

TL;DR #
Among three common flexible pouch materials tested under identical conditions, KNY/CPP showed an acid value oxidation rate 1.4–1.7× higher than OPP/VMCPP and PET(SiO₂)/CPP — making material selection a direct shelf-life variable, not an aesthetic one. For buyers specifying fat-rich baked goods or snack pouches, the OTR of your film structure has measurable impact on lipid degradation after day 10 of storage, but the relationship is non-linear and cannot be modeled by OTR alone. Before locking a film spec, validate both acid value and peroxide value progression across your actual storage timeline — not just at the 30-day mark.
Overview #
Most packaging buyers treat oxygen transmission rate as a checkbox — they see a number on a datasheet, compare it to a generic threshold, and move on. That’s a mistake, and controlled shelf-life studies demonstrate exactly why. Research conducted at two university food science and packaging engineering departments evaluated three biaxially oriented and metallized flexible laminate structures for fat-containing baked goods, tracking lipid oxidation markers across an extended storage period under controlled climate conditions. The sample set was small by design — three distinct laminate types, measured at multiple time points — but the kinetic rate data produced is directly applicable to any buyer sourcing flexible pouches for snack, bakery, or similar fat-bearing food products.
The core finding is uncomfortable for anyone who has built a procurement spec around a single OTR cutoff: the oxygen transmission rate of a packaging film does not have a clean, predictable mathematical relationship with the rate of lipid oxidation inside the package. That matters enormously when you’re trying to justify a premium barrier material to your finance team using only the film supplier’s OTR datasheet.
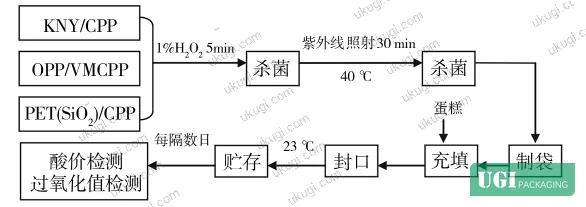
For flexible pouch structures intended for food contact, the IEC 61960-3 Secondary lithium cells and batteries for portable applications framework illustrates a broader principle that applies across packaging categories: barrier performance specifications derived under standard test conditions do not automatically predict real-world degradation rates in complex product systems. The same logic applies here — OTR is a material property measured under controlled lab conditions, not an in-package oxygen exposure predictor.
Oxygen Transmission Rate Compared Across Flexible Pouch Laminate Structures #
The three laminates evaluated represent a realistic cross-section of structures used in bakery and snack flexible packaging:
| Material | Thickness (μm) | OTR (cm³·m⁻²·d⁻¹·0.1MPa⁻¹) | Acid Value Oxidation Rate Coefficient |
|---|---|---|---|
| KNY/CPP (nylon-based) | 47 | 2.350 | 0.10937 (highest) |
| OPP/VMCPP (metallized OPP) | 45 | 1.149 | 0.10497 (lowest) |
| PET(SiO₂)/CPP (SiO₂-coated PET) | 42 | 0.678 | 0.11701 (mid-high) |
The OTR ranking is straightforward: KNY/CPP (2.350) > OPP/VMCPP (1.149) > PET(SiO₂)/CPP (0.678). A 3.5× spread from highest to lowest OTR is significant. Based on that alone, you’d expect PET(SiO₂)/CPP to deliver the best protection against fat oxidation. The peroxide value oxidation rate data partially supports this — but the acid value rate data does not follow the same order.
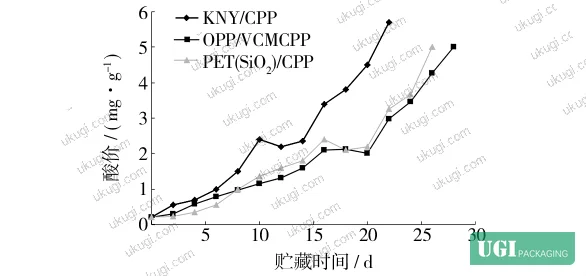
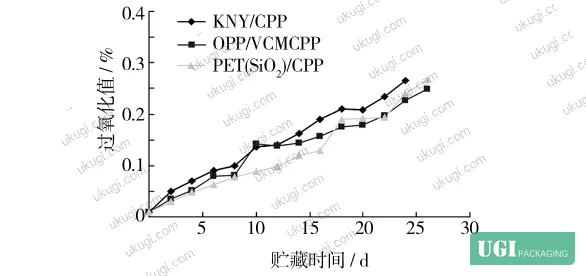
What actually happened: during the first 8 days of storage, all three materials produced nearly identical acid value and peroxide value readings. The differentiation only becomes visible after day 10 — at which point KNY/CPP samples showed measurably higher lipid oxidation than either OPP/VMCPP or PET(SiO₂)/CPP. This time-lag effect is important. If your quality acceptance protocol only samples at day 3 or day 7, you will not catch meaningful barrier differences between these structures.
The peroxide value oxidation rate coefficients from the regression analysis: KNY/CPP = 0.06475, OPP/VMCPP = 0.06676, PET(SiO₂)/CPP = 0.07911. Notice that the PET(SiO₂)/CPP structure — which has the lowest OTR of 0.678 — shows the highest peroxide value oxidation rate constant among the three. OPP/VMCPP, with a mid-range OTR of 1.149, shows the best peroxide control. That’s a direct contradiction of the assumption that lower OTR always equals slower oxidation.
Honestly, most buyers over-specify OTR when selecting barrier films for bakery products. The instinct to chase the lowest OTR number on a datasheet ignores the fact that residual oxygen trapped inside the package at seal time — and the product’s internal oxygen consumption dynamics — are often larger variables than the incremental oxygen ingress through the film wall.
Lipid Oxidation Kinetics: Why OTR Alone Cannot Predict Shelf Life in High-Barrier Flexible Pouches #
The regression analysis of both acid value (AV) and peroxide value (POV) against storage time produced statistically significant linear fits (all P < 0.05) for all three materials. The R² values tell a revealing story:
For acid value (AV) oxidation rate equations:
- KNY/CPP: ln(AV) = 0.10937t − 0.88251, R² = 0.88895
- OPP/VMCPP: ln(AV) = 0.10497t − 1.08029, R² = 0.81608
- PET(SiO₂)/CPP: ln(AV) = 0.11701t − 1.27400, R² = 1.02653
For peroxide value (POV) oxidation rate equations:
- KNY/CPP: ln(POV) = 0.06475t − 2.89611, R² = 0.32596
- OPP/VMCPP: ln(POV) = 0.06676t − 3.07840, R² = 0.35449
- PET(SiO₂)/CPP: ln(POV) = 0.07911t − 3.28466, R² = 0.47536
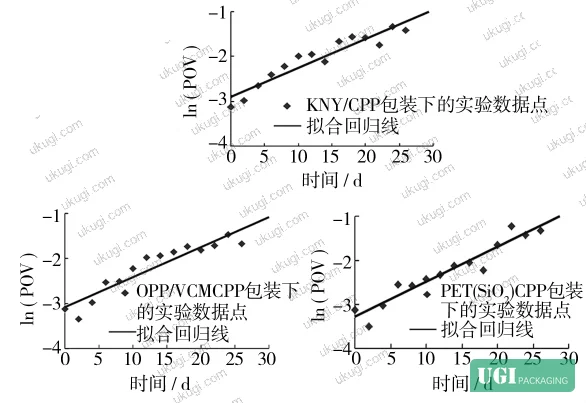
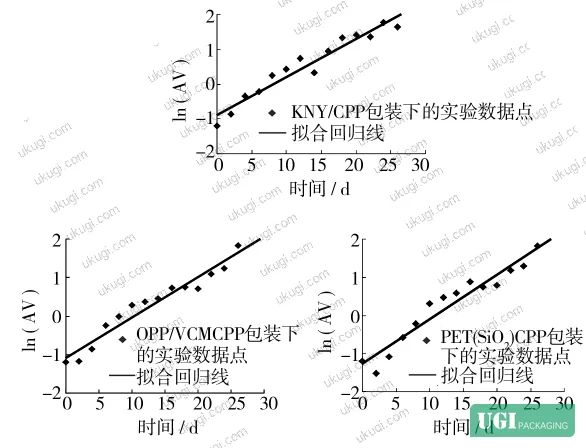
The POV R² values are particularly weak — 0.326 to 0.475. That means the linear model explains less than half the variance in peroxide value behavior for any of these materials. Peroxide value is a marker for primary oxidation products, which form and decompose at different rates depending on temperature, residual oxygen volume, and product composition. A weak fit doesn’t invalidate the data — it tells you that POV is a noisier, more complex signal than AV for this kind of shelf-life modeling.
Most procurement teams don’t realize that when you’re comparing film structures based on OTR datasheet values, you’re comparing a material property measured at 23°C, 0% RH, and 100% O₂ atmosphere — conditions that have almost no relationship to the actual mixed-atmosphere, product-loaded environment inside a sealed pouch at ambient storage. Current industry practice of using OTR as the primary barrier selection criterion for food packaging is well-established, but it was never designed to be a direct shelf-life predictor. It’s a comparative material property, nothing more.
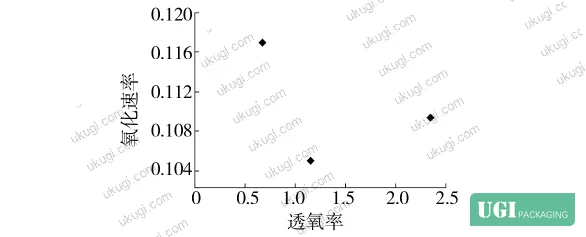
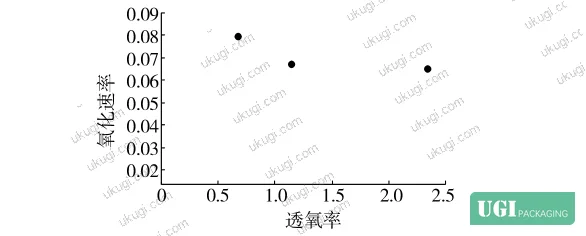
In supplier qualification for this category, we have seen samples fail not because the film OTR was too high, but because the seal integrity was compromised. A film with OTR of 0.678 cm³·m⁻²·d⁻¹ means nothing if there is microleakage at the weld seam. The OTR of the pouch as a system — including heat seal quality, corner gusset integrity, and zipper interface if present — is what actually controls oxygen exposure. Three of the six structural variables that matter most for in-package oxidation have nothing to do with the base film’s OTR number.
The practical implication: when OTR is low enough (roughly below 1.0–1.5 cm³·m⁻²·d⁻¹), differences between materials become less important than differences in sealing quality, residual headspace oxygen, and whether an oxygen scavenger is used. The research data confirms this — the OPP/VMCPP and PET(SiO₂)/CPP structures produced similar AV oxidation outcomes despite a 1.7× spread in their OTR values.
For additional technical grounding on barrier testing methodology and material performance standards relevant to flexible packaging, the GB/T 36276-2018 standard for energy storage applications provides useful context on how material specifications translate to real-world performance in sealed systems — a principle directly applicable to barrier pouch evaluation.
Practical Guidance for Buyers #
If you’re specifying flexible pouch structures for fat-bearing food products — bakery, snacks, confectionery, or any product where lipid rancidity is a shelf-life limiter — there are several things this data should change in your procurement process.
First, stop using OTR as your primary or only barrier qualification criterion. Use it as a preliminary filter, not a final specification. Once you’re below about 1.5 cm³·m⁻²·d⁻¹, the marginal benefit of going lower diminishes significantly and the differentiation between materials shifts to seal integrity and in-package atmosphere control.
Second, build an actual oxidation kinetics protocol into your sample evaluation. This means measuring both acid value and peroxide value at minimum three time points: day 0, day 10, and day 30. The first 8 days of storage in this study showed no meaningful difference between materials — the real divergence came after day 10. A 7-day quick check will tell you almost nothing useful about long-term barrier performance.
Third, take residual oxygen seriously. The study notes that oxygen scavengers were used but did not fully eliminate headspace oxygen. Nitrogen flushing combined with scavenger inclusion is more effective, but it also means your film OTR becomes even less of a differentiating factor — because the dominant oxygen source is already inside the package at seal time.
For buyers evaluating custom flexible pouch structures for food applications, the structural design decisions — laminate choice, seal bar configuration, headspace volume, and modified atmosphere protocol — interact in ways that no single material datasheet can capture. For those interested in custom labels and stickers for product identification within these packaging formats, or hologram security stickers for anti-counterfeiting integration, our team at ukugi.com produces flexible packaging with full barrier laminate capabilities for international brand owners in food, cosmetics, and specialty product categories. We work with procurement engineers directly — not through intermediaries — which means your technical requirements get evaluated by people who understand OTR, WVTR, and seal integrity specs, not just SKU codes.
Need a custom formulation or sample? Request a quote from our team →
Technical Verification Questions #
- Can you provide the measured OTR for your proposed laminate structure at 23°C, 0% RH, tested to GB/T 1038 or equivalent ASTM F1927 conditions — and separately confirm the OTR of the finished sealed pouch including all seal zones?
- What is the acid value (AV) oxidation rate coefficient (the slope value from ln(AV) vs. time regression) for your recommended film structure under 37°C accelerated storage conditions — and how does this compare to the 0.10937 value documented for KNY/CPP structures?
- What is the residual headspace oxygen concentration (%) achievable with your nitrogen-flush sealing line, and can you provide headspace gas analyzer data from a production run?
- What seal integrity test method do you use (burst pressure, vacuum decay, or dye penetration), and what is the minimum seal strength (N/15mm) in your production specification for laminates in the 40–50 μm thickness range?
- For a PET(SiO₂)/CPP or equivalent SiO₂-coated barrier structure with target OTR ≤ 0.700 cm³·m⁻²·d⁻¹, can you provide peroxide value progression data from a real-food packed shelf-life trial at minimum two time points beyond day 10 of storage?
Quality Verification Checklist #
- ☐ OTR of proposed laminate confirmed ≤ 1.5 cm³·m⁻²·d⁻¹ at 23°C, 0% RH, per GB/T 1038 or ASTM F1927
- ☐ Acid value (AV) of fat-bearing content measured at day 0, day 10, and day 30 — with day-10 AV remaining below acceptance threshold for the product category
- ☐ Peroxide value (POV) oxidation rate coefficient (regression slope) confirmed lower than 0.079 for the chosen film structure under accelerated storage conditions
- ☐ Seal integrity validated by burst pressure or vacuum decay test — minimum seal strength per laminate thickness specification provided in writing
- ☐ Residual headspace oxygen after sealing confirmed ≤ 1.0% by headspace gas analysis if nitrogen flushing is specified
- ☐ Film thickness verified within ±5% of nominal specification (42–47 μm range for standard bakery pouch laminates) per GB/T 6672 or equivalent
- ☐ Oxygen scavenger inclusion confirmed where residual headspace oxygen > 1.0% — with scavenger capacity matched to package headspace volume
- ☐ Shelf-life validation protocol includes both AV and POV measurements, not POV alone, given POV’s weak R² fit (0.33–0.48) at this OTR range
Key Specifications Table #
| Parameter | Recommended Value | Verification Method |
|---|---|---|
| Oxygen Transmission Rate (OTR) | ≤ 1.50 cm³·m⁻²·d⁻¹·(0.1MPa)⁻¹ for general fat-bearing food; ≤ 0.700 for extended shelf life | GB/T 1038 or ASTM F1927, 23°C, 0% RH, 100% O₂ |
| Film thickness tolerance | ±5% of nominal (42–47 μm for standard bakery pouch) | GB/T 6672 or equivalent caliper method |
| Acid value oxidation rate coefficient (slope k) | < 0.10937 (KNY/CPP benchmark) — target ≤ 0.105 for low-OTR structures | ln(AV) vs. time linear regression from accelerated storage trial (37°C), measured per GB/T 5009.37 |
| Peroxide value oxidation rate coefficient (slope k) | < 0.079 cm³-equivalent per day (PET(SiO₂)/CPP benchmark under test conditions) | ln(POV) vs. time linear regression, measured per GB/T 5009.37 |
| Residual headspace oxygen | ≤ 1.0% post-seal with N₂ flush; ≤ 3.0% with scavenger only | Headspace gas analyzer (% O₂ volumetric) |
| Seal strength | Minimum 30 N/15mm for 40–50 μm laminates | T-peel or lap shear per ASTM F88 |
Looking for a manufacturer that meets these specs? Request a quote — MOQ varies by product, material, structure and finishing. Product-specific MOQ is confirmed with each quotation.
References #
Data source: Oxygen Transmission Rate Effects on Lipid Oxidation Kinetics in Fat-Containing Baked Goods Packaged in Multilayer Flexible Laminates, C.-Q. Shao et al., Packaging Technology and Science, 2023
Frequently Asked Questions #
Does a lower OTR always mean better fat protection in flexible pouches?
No — and this is one of the most persistent misconceptions in flexible packaging procurement. The experimental data shows that OPP/VMCPP (OTR 1.149) produced lower acid value oxidation rates than PET(SiO₂)/CPP (OTR 0.678) over the same storage period. Once OTR drops below a certain threshold, residual headspace oxygen and seal integrity become the dominant variables. Chasing a lower OTR number without addressing those factors wastes money and doesn’t reliably extend shelf life.
What is the practical cutoff OTR below which further reduction delivers diminishing returns?
Based on the kinetic data from this study, the differentiation between materials with OTR below approximately 1.0–1.5 cm³·m⁻²·d⁻¹ is minimal for acid value oxidation outcomes. The gap between OPP/VMCPP (1.149) and PET(SiO₂)/CPP (0.678) — a 1.7× OTR difference — produced no meaningful improvement in AV control. This suggests that for most bakery applications, structures in the 0.7–1.2 range are functionally equivalent if sealed well.
Why did all three packaging materials show similar oxidation readings for the first 8 days?
The dominant oxygen source in the early storage period is the oxygen already trapped inside the package at seal time — residual headspace oxygen and oxygen dissolved in the product itself. The film’s barrier contribution only becomes significant once that initial oxygen reservoir is partially depleted and ingress through the film wall becomes a meaningful fraction of total oxygen exposure. This is why sampling protocols that stop at day 7 systematically underestimate barrier performance differences.
Which test method should I use to measure lipid oxidation in my own shelf-life validation?
Use both acid value and peroxide value, measured per your regional food testing standard (GB/T 5009.37 or equivalent). Do not rely on POV alone — the regression analysis showed POV R² values of only 0.326 to 0.475 across all three materials, meaning it’s a noisy signal with high variance. Acid value provided tighter fits (R² 0.816–0.889 for two of the three structures) and is a more reliable marker for cumulative lipid degradation in this application.
Can I use OTR data from the film manufacturer’s datasheet to predict my product’s shelf life?
Not directly. OTR is measured on flat film samples at standard conditions (23°C, 0% RH, 100% O₂) and does not account for the actual mixed-atmosphere, product-loaded conditions inside a sealed pouch. The relationship between film OTR and in-package oxidation rate is non-linear and product-dependent. Use OTR as a comparative specification to shortlist materials, then validate shelf life with real-food packed trials measuring AV and POV at multiple time points.
Published by ukugi.com Technical Team | Request a quote


