

TL;DR #
White cardboard production alone accounts for 37% of primary energy consumption and 79% of water consumption in a premium lenticular folding carton — making substrate selection the single highest-leverage decision in reducing your packaging’s environmental footprint. For buyers facing ESG reporting requirements or retailer sustainability mandates, this means the material specification sheet, not the finishing process, is where carbon reduction efforts should start. Specify high-bulk white cardboard (285 g achieving equivalent stiffness to 400 g standard grade) and request LCA data from your supplier before sampling begins.
Overview #
Most packaging buyers approaching LCA for the first time assume that printing and finishing processes are the dominant contributors to environmental impact. The research challenges that assumption directly — and the numbers are hard to argue with. A full life cycle assessment conducted by a university-based packaging engineering institute on a production batch of 500,000 units, using actual factory input/output data from a Guangdong manufacturer, found that the two raw materials — white cardboard and the custom lenticular film — together account for over 70% of both primary energy consumption and climate-relevant gas emissions. The study modeled 9 environmental impact categories across 7 discrete production stages using the e-Footprint platform, drawing inventory data from the CLCD and Ecoinvent background databases.
The product in question is a premium lenticular folding carton — the insert-lock style box measuring 55 mm × 38 mm × 185 mm constructed from 400 g white cardboard laminated with a custom cat-eye (Fresnel lens) film. This format is widely used in cosmetics, spirits, and fast-moving consumer goods where shelf differentiation is a primary packaging objective.

Understanding how this type of packaging accumulates environmental impact across its production chain is increasingly non-negotiable. Retail and brand customers in North America and Europe are requiring life cycle data at RFQ stage. The ISO 22000:2018 Food safety management systems for food packaging framework, while food-focused, has accelerated the expectation that packaging suppliers maintain full process documentation — and sustainability data is following the same trajectory.
LCA Methodology: Scope, System Boundary, and What Was Actually Measured #
The assessment was structured according to GB/T 24040 (the Chinese equivalent of ISO 14040), covering the full production chain from raw material inputs through to the finished glued box. The system boundary explicitly excluded end-of-life waste treatment scenarios and inter-factory transport, which keeps the scope clean but also means the reported figures represent a floor estimate — actual cradle-to-grave carbon would be higher.
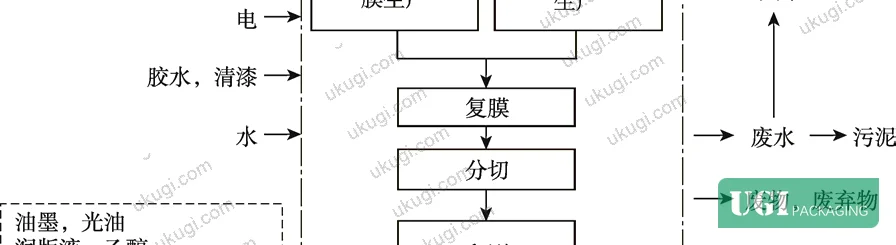
Seven production stages were modeled as discrete process units:
- Custom lenticular film manufacture (PET substrate, photosensitive emulsion, vacuum-deposited aluminum)
- White cardboard production (wood pulp, calcium carbonate, sizing agents)
- Film-to-board lamination
- Roll slitting to flat sheets
- Color printing (UV offset, inline UV varnish coat)
- Die cutting
- Gluing and box forming

The input inventory for 500,000 boxes included 11,136 kg of wood pulp, 1,920 kg of calcium carbonate, 384 kg of sizing agents, 255 kg of photosensitive emulsion, 521 kg of adhesive, 835 kg of PET film, 6.4 kg of aluminum, 47 kg of ink, 144 kg of UV varnish, 26.5 kg of lacquer, 115,610 kg of water, and 18,145 kWh of electricity. Ancillary process materials — nickel plates, dampening solution, ethanol, CTP plates, developer — were excluded under the CLCD cut-off rule (each below 1% of process output mass, total excluded mass below 5% of total).
The nine environmental impact categories evaluated were: primary energy demand (PED), abiotic depletion potential (ADP), water use (WU), global warming potential (GWP), ozone depletion potential (ODP), acidification potential (AP), photochemical ozone creation potential (POFP), eutrophication potential (EP), and ecotoxicity (CTUe).
Honestly, for most procurement teams, tracking all nine categories simultaneously is operationally impractical. The data shows that PED, WU, and GWP are where the real material differences exist — the others are genuinely secondary for this product category. Focus your supplier conversations on those three.
Carbon Footprint per Carton: The Numbers That Drive Procurement Decisions #
Per single carton, the LCA results across all nine impact categories are:
| Environmental Impact Category | Result per Carton | Uncertainty (95% CI) |
|---|---|---|
| Primary Energy Demand (PED) | 705 kJ | [607, 804] kJ |
| Abiotic Resource Depletion (ADP) | 131 g (Sb eq.) | [114, 148] g |
| Water Consumption (WU) | 350 g | [214, 486] g |
| Climate Change (GWP) | 48.3 g CO₂eq. | [40.9, 55.7] g |
| Ozone Depletion (ODP) | 0.59 g CFC-11 eq. | [0.481, 0.70] g |
| Acidification (AP) | 255 mg SO₂eq. | [224, 286] mg |
| Photochemical Ozone Creation (POFP) | 54.8 mg C₂H₆ eq. | [47.2, 62.5] mg |
| Eutrophication Potential (EP) | 32.1 mg PO₄³⁻ eq. | [28, 36.2] mg |
| Ecotoxicity (CTUe) | 1.56 × 10⁻³ CTUe | [1.36×10⁻³, 1.76×10⁻³] |
The climate change figure of 48.3 g CO₂eq. per box is the number most relevant to brand-level carbon accounting. Scaled to a production run of one million units, that represents approximately 48.3 tonnes of CO₂ equivalent — a non-trivial figure when your brand is working toward Scope 3 emissions reduction targets.
The water consumption uncertainty is the outlier in the dataset. The 38.82% uncertainty on the 350 g WU figure — with a 95% confidence interval stretching from 214 g to 486 g — is significantly wider than the 12–19% range observed for all other impact categories. The primary driver is variability in wastewater treatment performance data from the paper mill supply chain. This is a known limitation of LCA studies that rely on upstream background database values rather than direct mill measurement.
Cumulative Contribution by Production Stage: Where the Impact Is Actually Generated #
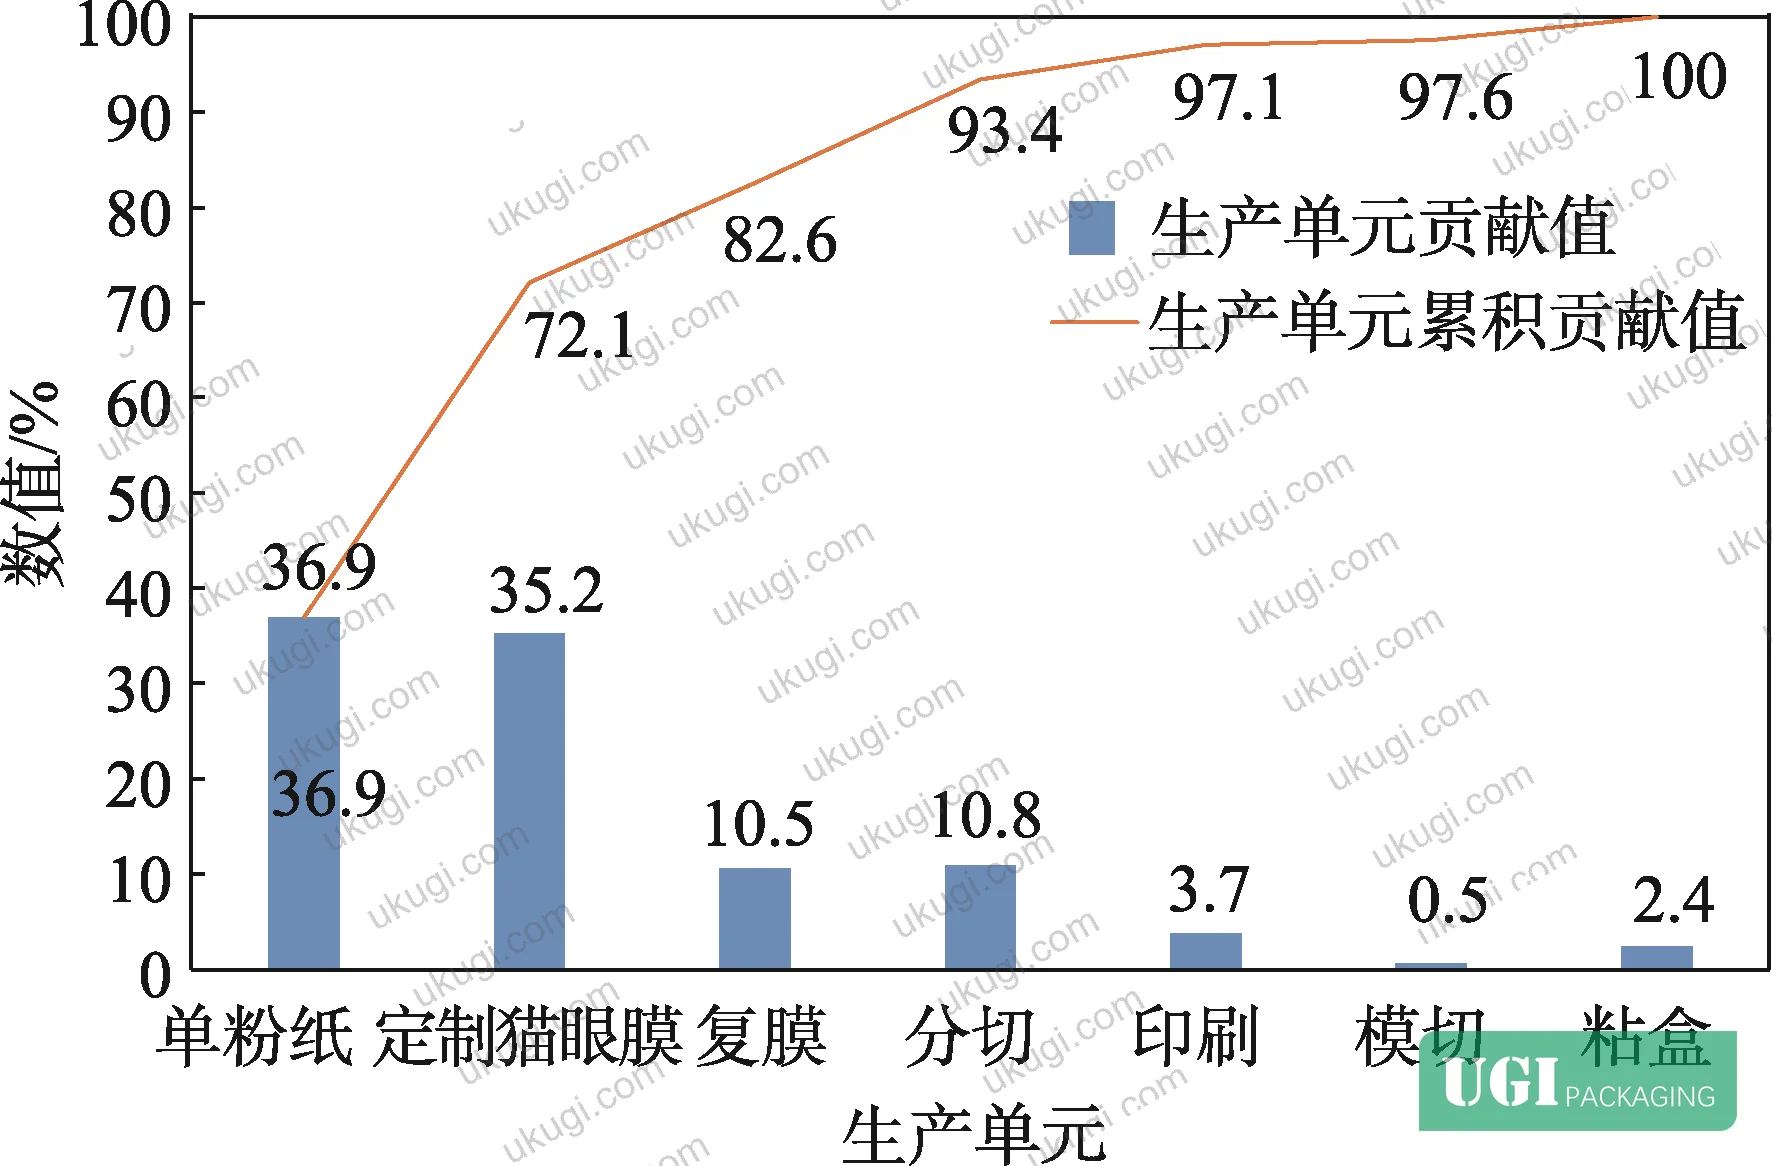
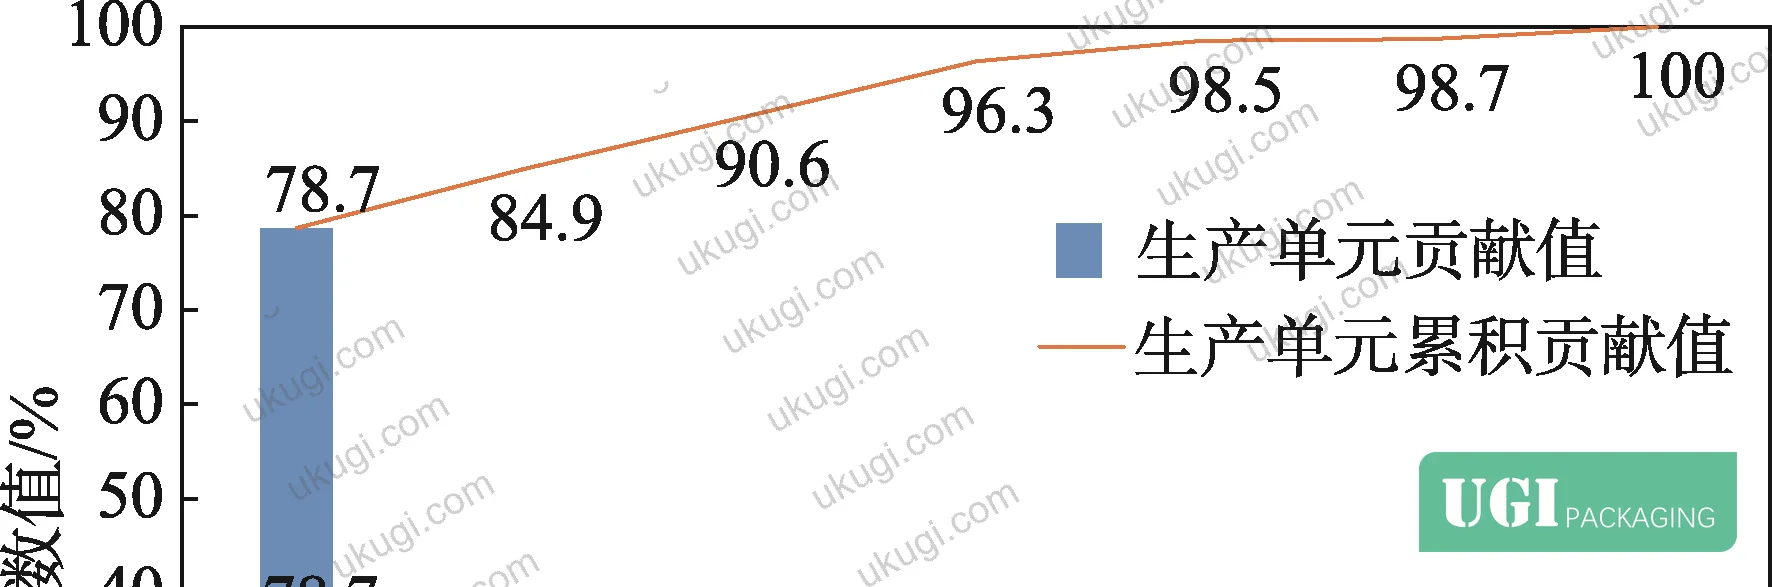
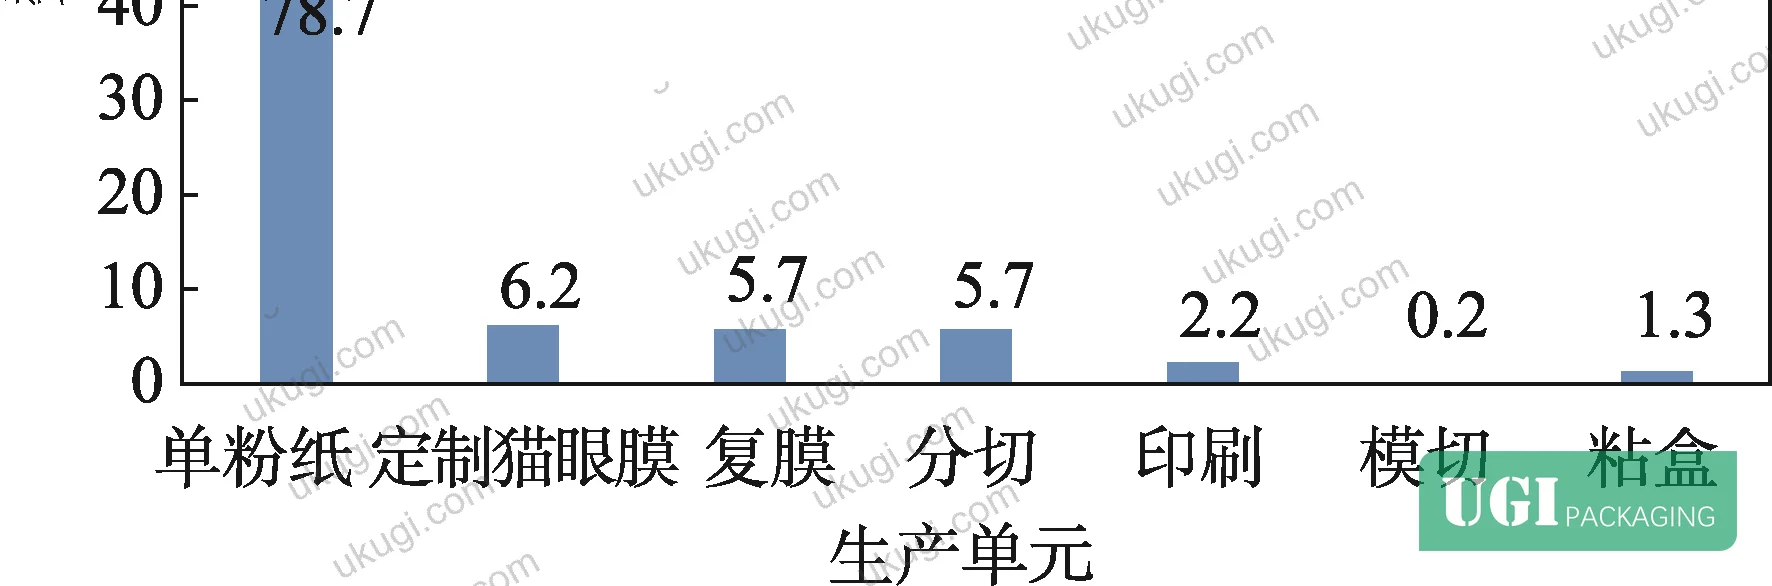
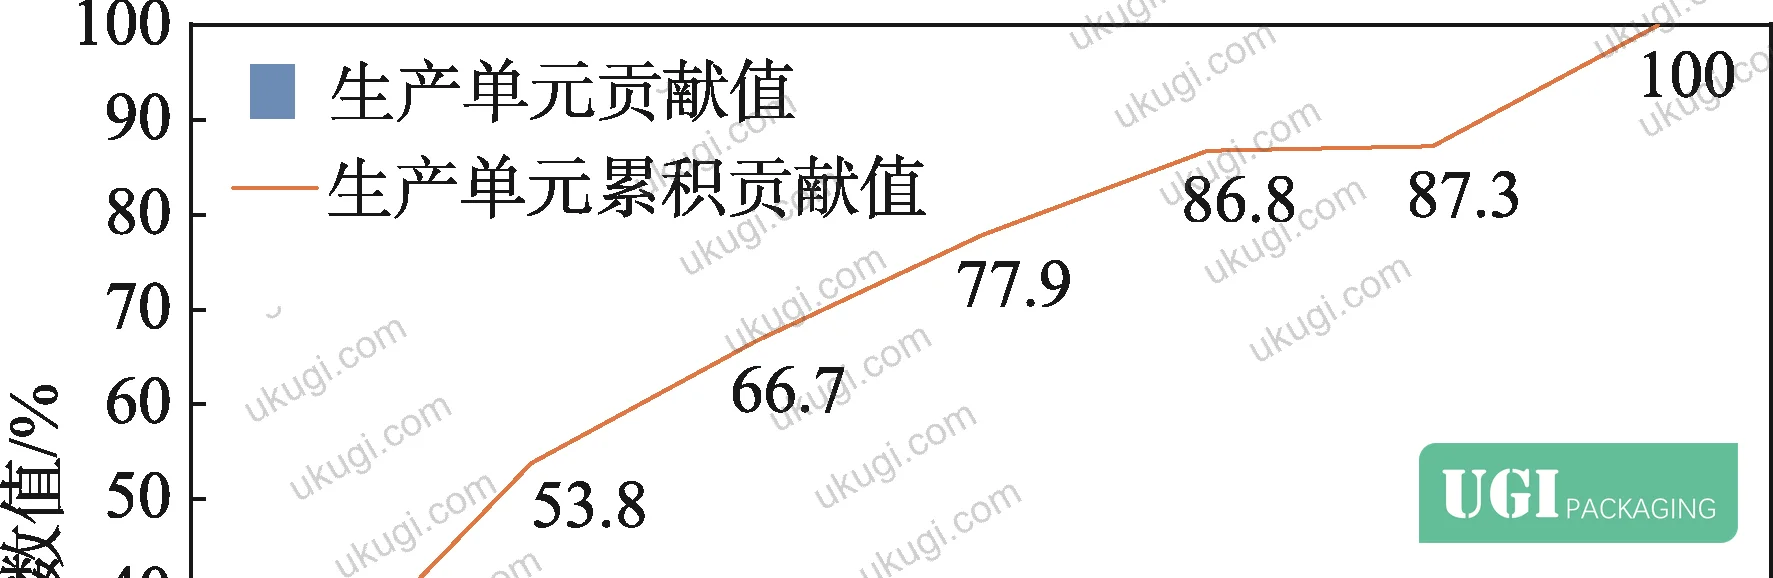
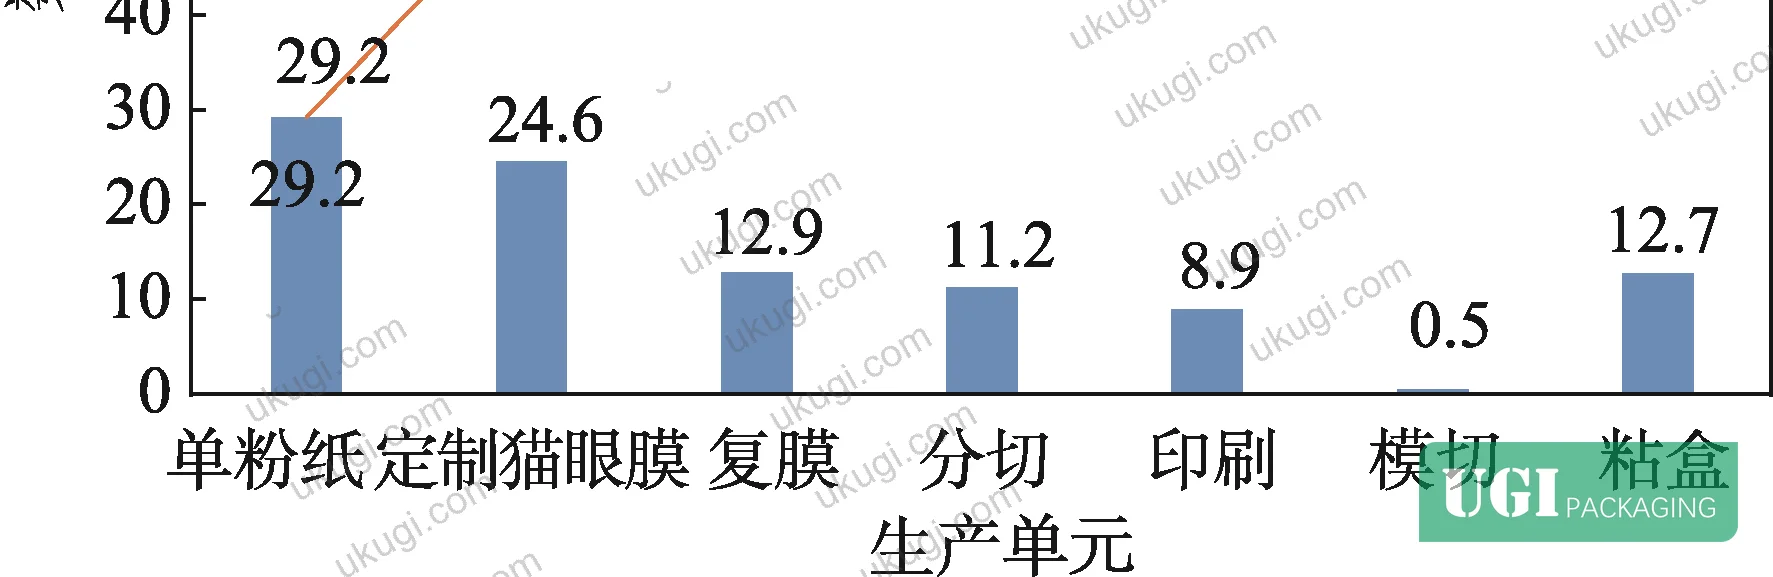
This is where the data gets useful for procurement decisions. Breaking down cumulative contributions across the seven production stages reveals a very uneven distribution:

| Production Stage | PED Contribution | Water Use Contribution | GWP Contribution |
|---|---|---|---|
| White cardboard production | 36.9% | 78.7% | 29.2% |
| Custom lenticular film production | 35.2% | 6.2% | 24.6% |
| Lamination | 10.5% | 5.7% | 12.9% |
| Roll slitting | 10.8% | 5.7% | 11.2% |
| Printing | 3.7% | 2.2% | 8.9% |
| Die cutting | 0.5% | 0.2% | 0.5% |
| Gluing | 2.4% | 1.3% | 12.7% |


A few things to note in this table. The lenticular film contributes only 6.2% of water consumption but 24.6% of GWP — its environmental footprint is energy-intensive rather than water-intensive, which is a different risk profile than the cardboard substrate. Gluing contributes 12.7% of GWP despite consuming minimal energy and water, which points to adhesive chemistry as an underappreciated emissions source. And printing, which most buyers associate with environmental concern, contributes only 3.7% of PED and 8.9% of GWP — less than the gluing stage.
Most procurement teams don’t realize that the film lamination component carries a climate impact nearly equal to the paper substrate, despite being a fraction of the total material mass. Current industry reporting frameworks are only beginning to require film-specific environmental declarations alongside the board certifications that buyers already routinely request.
Process Improvement Pathways: Six Strategies Supported by the Data #
The LCA findings directly suggest six intervention points, ranked roughly by impact magnitude.
Film elimination or transfer-process film. The lenticular film is the most environmentally complex component to recycle — laminated cartons require separation before repulping, and most municipal recycling streams cannot handle them. Switching to a PET transfer-process film allows the base film to be peeled from the laminate after bonding, leaving only the optical coating on the board. This enables repulping while also recovering the PET carrier for reuse. The reduction in microplastic contamination from landfilled or incinerated laminated cartons is an additional benefit that is not captured in the production-scope LCA but is increasingly relevant to extended producer responsibility schemes.
High-bulk white cardboard substitution. Using 285 g high-bulk white cardboard in place of 400 g standard white cardboard can achieve equivalent stiffness and surface quality. The mechanism is straightforward: increasing free water content during papermaking increases hydrogen bonding between microfibrils, producing a thicker, more dimensionally efficient sheet at lower grammage. This directly reduces wood pulp consumption, tree harvesting, and the water-intensive pulping process — all of which map onto the 78.7% water consumption contribution from the board stage.
Dimensional optimization. Shifting the front-to-side panel junction 9–10 mm downward on the box blank reduces board usage while preserving the full display face dimensions. This is a structural design change that can be implemented without affecting shelf presence.
Film specification relaxation. The custom lenticular film is specified to tight registration tolerances. Accepting slightly coarser positioning tolerance enables use of thinner PET base film and thinner UV coating — reducing material mass and the associated energy footprint of film production without compromising optical effect quality for most viewing distances.
Renewable energy sourcing for production. Electricity in the study accounts for 18,145 kWh per 500,000-unit batch. Given that the Chinese grid electricity mix used in the background database is predominantly coal and natural gas, this electricity generates SOx, NOx, CO₂, and particulates that contribute meaningfully to acidification and GWP. Transitioning to solar or hydropower sourcing for the production facility would reduce the electricity-related impact footprint — a change that becomes verifiable through green energy certificates.
Papermill wastewater treatment optimization. Given that white cardboard production drives 78.7% of water consumption, improving chemical efficiency and wastewater treatment performance in pulping upstream has the highest leverage on the WU metric. This is a supply chain intervention rather than a design change, and it requires active engagement with the board supplier.
Practical Guidance for Buyers #
If you’re building a carbon footprint disclosure for a product line that includes premium laminated folding cartons, don’t start with the printing process. The data is clear: your substrate selection and film specification together determine more than 60% of your per-unit carbon number. Get material-specific environmental product declarations (EPDs) from your board supplier before you finalize grammage, and ask whether their mill runs on grid power or renewable sourcing.
For buyers evaluating suppliers of lenticular or specialty laminated cartons, the qualification conversation should explicitly cover the film lamination process. Ask specifically whether transfer-process film is available, and whether the supplier can provide per-SKU LCA modeling rather than generic category averages. Suppliers who can’t answer either question are operating without the process documentation that sustainability audits now require.
The ISO 14021:2016 Environmental labels and declarations standard is the relevant framework for evaluating self-declared environmental claims from carton suppliers. Any claim of “reduced carbon” or “eco-friendly lamination” should be backed by a methodology that aligns with this standard — not just a marketing assertion. Similarly, for board sourcing, FSC Forest Stewardship Council — Standards for responsible paper and board sourcing certification confirms responsible fiber sourcing upstream, which directly addresses the deforestation component of the white cardboard carbon footprint.
At ukugi.com, our team in Guangzhou works directly with brand owners and procurement managers across North America, Europe, and the Middle East who are navigating exactly this kind of specification decision. We produce custom paper boxes with full surface finishing capabilities and can provide process-level environmental data to support your sustainability documentation. For cosmetics and personal care brands specifically, our cosmetics packaging solutions team has experience specifying high-bulk substrates and transfer-film laminates that reduce material intensity without compromising premium aesthetics.
Need a custom formulation or sample? Request a quote from our team →
Supplier Qualification Questions #
- What is the grammage and bulk specification of your white cardboard substrate, and can you provide mill-level EPD data showing primary energy consumption and water use per tonne of board produced — specifically whether PED from paper production falls within the 37% range of total carton PED seen in industry LCA data?
- Does your lenticular or specialty film lamination process use a standard lamination or a PET transfer-process film — and if transfer-process, what is the residual PET film deformation rate after peeling, and can the recovered film be reused in subsequent production cycles?
- Can you provide per-SKU LCA modeling output from e-Footprint or equivalent ISO 14040-compliant software showing GWP per carton not exceeding 48.3 g CO₂eq. for a standard lenticular folding carton in the 55 mm × 38 mm × 185 mm size class?
- What is the electricity consumption per 500,000-unit production batch, and what percentage of that electricity is sourced from renewable generation (solar, hydro, or certified green power) — given that grid-electricity-based production at approximately 18,145 kWh per 500,000 units carries significant SOx and NOx co-emissions?
- What is the uncertainty range on your water consumption LCA results, and has your team investigated whether mill wastewater treatment variability is the primary driver — since the reference data shows WU uncertainty reaching 38.82% (95% CI: 214–486 g per carton) when upstream mill data is sourced from background databases rather than direct measurement?
Quality Verification Checklist #
- ☐ Supplier provides LCA documentation covering all 9 environmental impact categories with GWP result ≤48.3 g CO₂eq. per carton for equivalent product format
- ☐ White cardboard substrate is specified at ≤285 g high-bulk grade (or equivalent stiffness to 400 g standard) with documented reduction in fiber input
- ☐ LCA data quality uncertainty for primary energy consumption is ≤15% (reference benchmark: 14.00% at 95% CI [607, 804] kJ per carton)
- ☐ Water consumption LCA uncertainty is below 40%, with uncertainty drivers identified and documented (benchmark: 38.82% flagged as requiring further investigation)
- ☐ Film lamination process is confirmed as either film-free, transfer-process PET, or carries explicit end-of-life separation documentation compliant with local recycling stream requirements
- ☐ LCA system boundary explicitly covers all 7 production stages from raw material input to finished box, consistent with GB/T 24040 / ISO 14040 scope requirements
- ☐ Board substrate sourced from FSC-certified or equivalent responsibly managed fiber supply chain
- ☐ Electricity consumption data for production batch is documented with renewable energy share percentage disclosed
Key Specifications Table #
| Parameter | Recommended Value | Verification Method |
|---|---|---|
| Primary energy demand per carton | ≤705 kJ (target: reduce via high-bulk board and renewable energy) | e-Footprint or ISO 14040-compliant LCA modeling, CLCD/Ecoinvent background database |
| Global warming potential (GWP) per carton | ≤48.3 g CO₂eq. (95% CI upper bound: 55.7 g) | LCA climate change impact category, CO₂/CH₄/N₂O/HFCs normalized to CO₂eq. |
| Water consumption per carton | ≤350 g (target: reduce by switching to high-bulk board) | LCA water use category, freshwater/surface water/groundwater aggregated |
| White cardboard energy contribution | ≤37% of total PED | Process-level cumulative contribution analysis across 7 production stages |
| Lenticular film GWP contribution | ≤25% of total GWP | Process-level cumulative contribution, film production stage isolation |
| LCA result uncertainty — PED | ≤15% at 95% confidence | CLCD data quality assessment protocol, Monte Carlo uncertainty propagation |
| Abiotic resource depletion (ADP) | ≤131 g Sb eq. per carton | LCA abiotic depletion category, metals normalized to antimony equivalent |
| Acidification potential (AP) | ≤255 mg SO₂eq. per carton | LCA acidification category, SO₂/NOx/NH₃/HF normalized to SO₂ equivalent |
Looking for a manufacturer that meets these specs? Get a free sample — MOQ starts at 500 units.
References #
Data source: Life Cycle Assessment of Premium Lenticular Laminated Folding Cartons: Energy, Water, and Climate Impact Across Seven Production Stages, H.-G. Zeng et al., Journal of Cleaner Production, 2024
Frequently Asked Questions #
What does 0.05 kg CO₂eq. per carton actually mean for brand-level sustainability reporting?
At 48.3 g CO₂eq. per unit, a production run of one million cartons contributes approximately 48.3 tonnes of CO₂ equivalent to your Scope 3 emissions inventory. For brands reporting under GHG Protocol or responding to retailer sustainability questionnaires, this figure needs to be supported by documented LCA methodology — not estimated from spend-based proxies. The per-carton figure from a credible LCA is also the starting point for comparing alternative substrate or finishing specifications against each other in a like-for-like carbon comparison.
Which production stage offers the most immediate carbon reduction opportunity?
White cardboard production at 36.9% of PED and 78.7% of water consumption. Substituting 285 g high-bulk board for 400 g standard white cardboard is the single highest-leverage intervention because it reduces fiber input, pulping water demand, and drying energy simultaneously. The lenticular film stage is a close second for GWP at 24.6%, but film substitution involves more complex supply chain and aesthetic trade-offs.
Is the 38.82% uncertainty on water consumption a problem for reporting purposes?
It’s wide enough to flag. The 95% confidence interval spans 214 g to 486 g per carton — more than a 2× range. This level of uncertainty is acceptable for internal benchmarking but would require tightening before submitting to a third-party verifier or using the figure in a public environmental claim. The primary fix is direct mill measurement of wastewater treatment performance rather than relying on background database values.
Does UV varnish coating contribute significantly to the environmental profile?
No, not at the level this study measured. The printing stage — which includes inline UV varnish application — contributes only 3.7% of PED and 8.9% of GWP. The varnish and ink inputs were among the materials that passed the CLCD cut-off threshold (each below 1% of process output mass). This is actually counterintuitive to most buyers who assume specialty coatings are a meaningful sustainability concern — for this carton format, they simply aren’t the driver.
Can this LCA methodology be applied to other folding carton formats?
Yes, with scope adjustments. The seven-stage production model and nine environmental impact categories are applicable to any folding carton that combines a board substrate with a specialty film laminate. The specific contribution percentages will shift depending on box dimensions, board grammage, film type, and print coverage — but the general finding that substrate materials dominate the footprint is consistent across similar formats in industry evaluations. A buyer evaluating multiple carton formats should request stage-level contribution breakdowns, not just total per-unit figures, to enable meaningful comparison.
Published by ukugi.com Technical Team | Request a quote


