

TL;DR #
Across 27 holographic substrate and print samples tested with an integrating sphere spectrophotometer, 7 out of 9 semi-finished prints with ΔE*ab ≥ 2.0 failed visual acceptance — a 100% correlation between instrument measurement and trained evaluator judgment. For buyers sourcing cigarette packaging or any holographic-finish printed goods, this means instrument-based color acceptance is no longer optional; it is the only method that delivers repeatable, defensible results. Before placing any holographic print order, require your supplier to demonstrate a documented multi-point scanning protocol on the actual substrate type, not a single-point spot measurement.
Overview #
Color measurement on holographic substrates is one of the most technically underserved areas in tobacco and premium packaging procurement. Most quality teams are still relying on trained inspectors under a lightbox — which is fine for flat CMYK stock, but breaks down completely the moment you introduce a surface diffraction grating. The angular color shift inherent to holographic (laser) paper means a single-point measurement at one orientation is almost meaningless for batch acceptance.
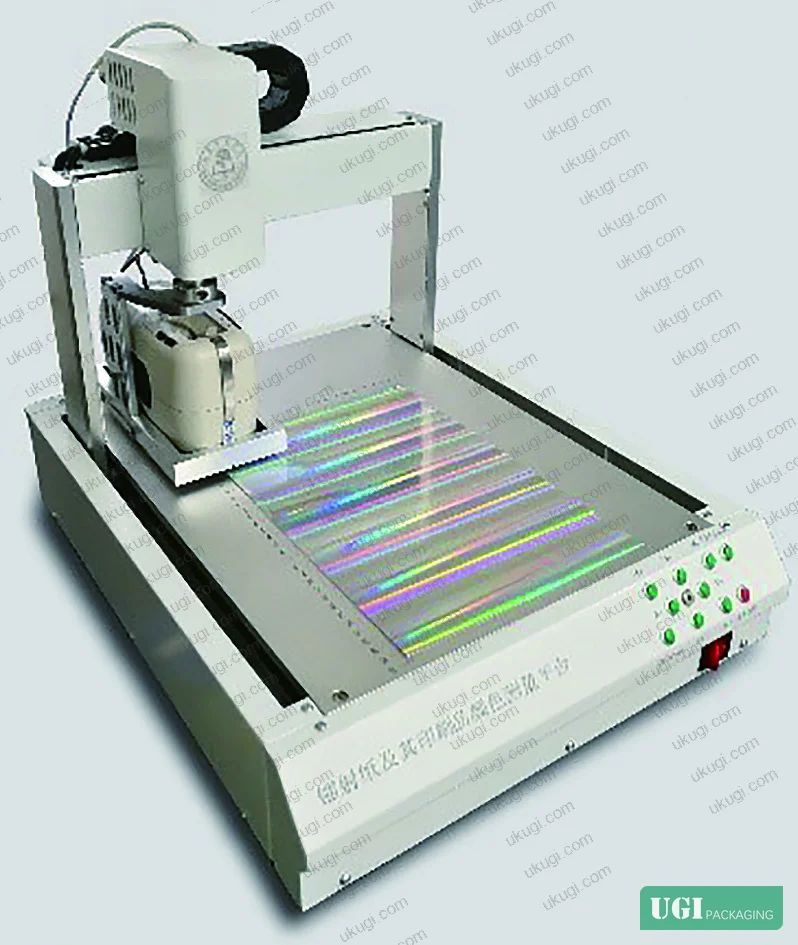
The evaluation data discussed here comes from a controlled trial conducted at a polytechnic-affiliated printing laboratory in collaboration with a major Chinese tobacco packaging manufacturer, covering 27 distinct sample groups: 12 raw holographic substrates, 9 semi-finished prints (post-printing, pre-finishing), and 6 finished print products (full post-press complete). The platform used was a custom XY-axis automated stage paired with an X-Rite Ci64 integrating sphere spectrophotometer operating under SCI (specular component included) conditions with a 4 mm aperture — a configuration chosen specifically to suppress the grating-induced angular dependency that renders handheld spot measurements unreliable. Measurement results were cross-validated against blind visual assessments performed by QC professionals under standard viewing conditions.
This kind of rigorous multi-point approach is directly applicable to any buyer sourcing hologram security stickers, foil-laminated cartons, or specialty tobacco packaging where surface optical effects are part of the brand specification. Understanding how color is measured — and how it fails to be measured — is the single most useful thing a procurement engineer can bring to a supplier qualification conversation.
Color Measurement Methods for Holographic Print Substrates #
The fundamental challenge with holographic paper is that its surface diffraction grating scatters light in angle-dependent patterns. Illuminate it at a fixed angle and you get one color reading; rotate it 30° and you get a measurably different one. This is not a defect — it is the designed optical behavior. But it creates a genuine measurement problem when you need to establish whether batch B matches reference standard A.
Two measurement protocols were developed and validated in this study:
Row-Column Scanning Method — Suited to large uniform-color regions. The instrument traverses the sample in a linear grid pattern. The validated configuration uses 17 sampling points at 3 mm intervals, perpendicular to the light-column (optical grating) direction, ensuring the scan crosses one complete 50 mm light-column cycle. For production-line applications where throughput matters, a reduced configuration of 10 sampling points at 5 mm intervals was found to satisfy enterprise quality management requirements while cutting measurement time.
Fixed-Point Rotation Method — Suited to finished prints where graphic design elements leave insufficient uniform-color area for linear scanning. The instrument holds position but rotates through angular increments. The validated configuration uses 7 sampling points at 30° rotation intervals, which effectively samples the full light-column cycle within a small-area zone. A 5-point × 45° variant also exists but generates larger variance due to the reduced angular sampling density.
Both methods use ΔEab (CIELAB color difference) as the acceptance metric. The enterprise-grade acceptance threshold applied throughout this evaluation was ΔEab ≤ 2.0 for raw substrates and semi-finished prints, with a modified threshold of ΔE*ab ≤ 3.0 tolerated specifically for fixed-point rotation measurements on certain gold-finish finished products, where the measurement geometry inherently inflates variance.
| Method | Configuration | Suitable Material Stage | Acceptance Threshold |
|---|---|---|---|
| Row-Column Scanning | 17 pts × 3 mm interval | Raw substrate, semi-finished print | ΔE*ab ≤ 2.0 |
| Row-Column Scanning (fast) | 10 pts × 5 mm interval | Production-line batch QC | ΔE*ab ≤ 2.0 |
| Fixed-Point Rotation | 7 pts × 30° rotation | Finished print, small uniform area | ΔE*ab ≤ 2.5–3.0 |
| Fixed-Point Rotation (reduced) | 5 pts × 45° rotation | Finished print, limited area | ΔE*ab ≤ 3.0 (relaxed) |
The instrument platform itself operates within a 600 mm × 500 mm × 500 mm envelope, powered at AC 220V / 50Hz with a maximum draw of 230W. The XY travel range is ≤ 350 mm per axis, with a positioning accuracy of ≤ 5 mm — sufficient for the measurement intervals used. Interface is USB direct-to-PC, with the mechanical stage designed to accept X-Rite Ci64 and similar integrating sphere instruments without adapter modification.
Buyers who want to understand the underlying colorimetric framework should reference ISO 12647-2:2013 Graphic technology — Process control for offset lithographic printing, which establishes the ΔE*ab framework used across most print color acceptance systems, even when the substrate in question is holographic rather than conventional offset stock.
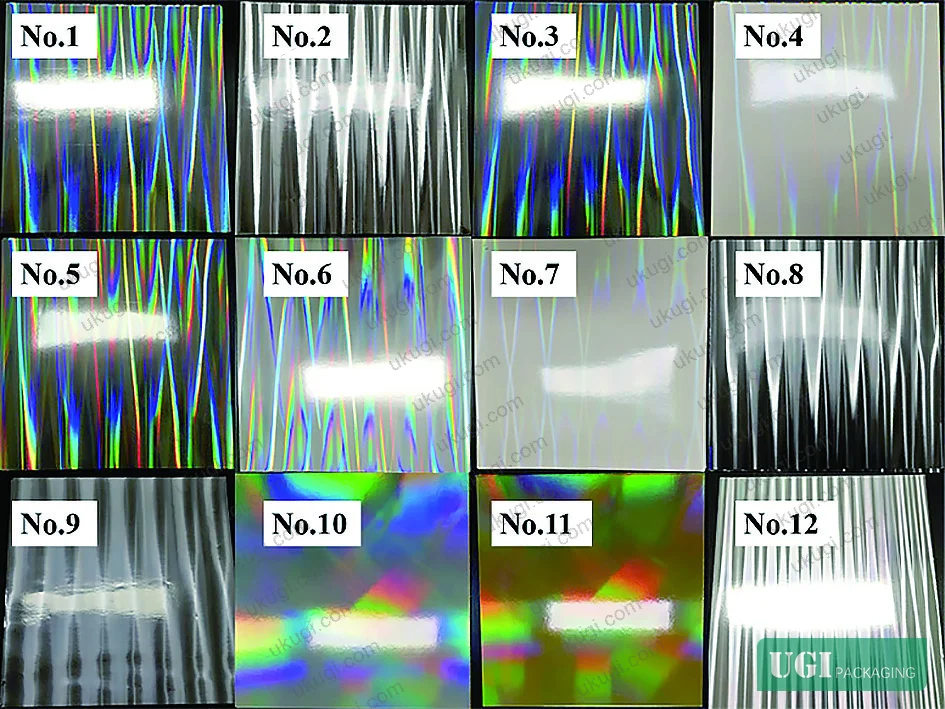
Color Difference Results Across Holographic Print Stages #
The three-stage evaluation — raw substrate, semi-finished print, finished print — produced clearly differentiated results that carry direct implications for where in the production chain color control is most critical.
Raw Substrate Group (No.1–12)
Of 12 holographic raw substrate samples tested using row-column scanning at 17 points × 3 mm, 11 passed the ΔEab ≤ 2.0 acceptance threshold. The single outlier, No.12, initially showed ΔEab values of 2.16, 2.38, 3.12, 2.41, and 2.91 across five test specimens — all failures. Investigation traced this not to a substrate batch problem but to physical abrasion damage on the reference standard being used for comparison. Once the worn reference was replaced, the same No.12 specimens returned values of 0.20, 0.72, 0.89, 0.85, and 2.16 — with the residual 2.16 representing the comparison against the original (now confirmed-worn) reference. This is a textbook example of reference standard management failure contaminating measurement data, and it happens more often than quality teams admit.
Because unprinted holographic substrates produce such intense rainbow and light-column optical effects, visual evaluation by trained personnel was considered impractical for this sample group. The instrument-only approach is therefore the only viable method for incoming raw material QC at this stage.
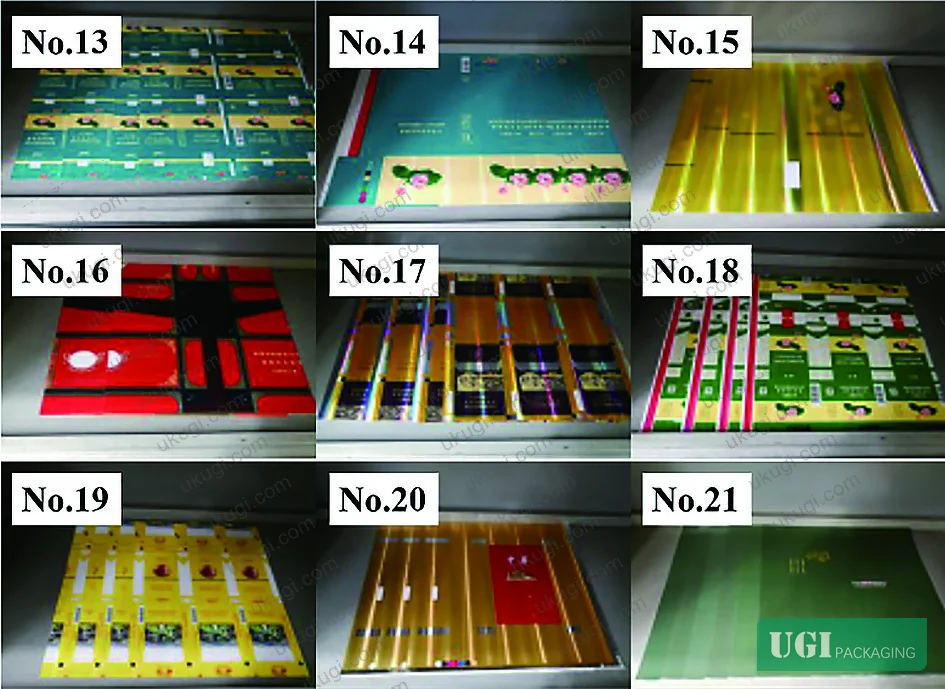
Semi-Finished Print Group (No.13–21)
Nine semi-finished print samples were measured, several containing multiple large uniform-color regions and therefore subjected to multiple row-column scans per sample. Out of all test specimens, 7 returned ΔE*ab ≥ 2.0 — and every one of those 7 was rated “obvious color difference, not acceptable” in blind visual evaluation by QC professionals. The correlation was 100%.
Three additional specimens — No.14 Yellow Sample 1 (ΔEab = 1.74), No.14 Green Sample 4 (ΔEab = 1.87), and No.21 Green Sample 3 (ΔEab = 1.95) — fell below the 2.0 threshold instrumentally but were nonetheless rated as having obvious, unacceptable color difference by visual assessment. The likely explanation is that human vision is significantly more sensitive to yellow-green hue shifts than to differences in other color regions — a well-established characteristic of the CIE standard observer that the ΔEab metric does not fully account for in the yellow-green gamut zone.
This is worth flagging: if your production involves yellow or green ink on holographic stock, set your internal acceptance threshold tighter than 2.0 — closer to 1.5 — for those color channels. The data supports it.
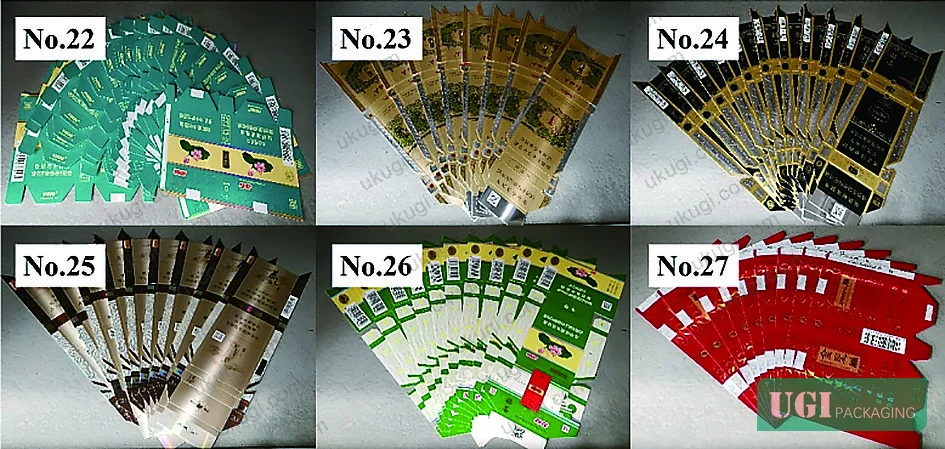
Finished Print Group (No.22–27)
Six finished print samples — cyan (No.22), gold (No.23), black (No.24), silver (No.25), green (No.26), and red (No.27) — were measured using both row-column scanning and fixed-point rotation. Post-press finishing operations (silkscreen overprint, UV coating, varnishing) consistently reduced inter-sample color variance, and all samples returned ΔE*ab values below 2.5 on row-column scanning.
On fixed-point rotation, five of the six samples remained under 2.5, but No.23 Gold repeatedly measured around 3.0 regardless of how many times the test was repeated. This is a geometry issue, not a quality defect — gold metallic finishes respond differently to rotational angular sampling because specular reflection from metallic pigment particles creates localized high-variance zones that the rotation method amplifies. The practical recommendation from this evaluation is to apply a 3.0 threshold specifically for gold/metallic finishes when fixed-point rotation is the only feasible measurement method.
Most procurement teams don’t realize that color acceptance limits in holographic print contracts are rarely substrate-specific — the same ΔE*ab ≤ 2.0 clause gets applied to white paper, silver foil, and full holographic stock indiscriminately. That is a specification error that produces unnecessary rejection disputes and reruns. Separate thresholds for substrate type and measurement method should be written into the purchase order.
Holographic Substrate Printing: Practical Implications for Color Control #
One industry observation worth flagging: the print industry has increasingly standardized colorimetric QC for conventional substrates, but holographic and diffraction-effect materials have largely been left outside those frameworks. Current color management standards — while technically sound for flat, non-specular stock — do not address the angular measurement protocols needed for grating-surface materials. Buyers sourcing tobacco packaging, premium cosmetics packaging, or security-label stock with holographic elements are operating in a quality control gap that most suppliers fill with nothing more than trained-eye inspection.
That gap is real and it has cost consequences. In the semi-finished print evaluation described above, three of the nine sample types had specimens that failed visual acceptance despite ΔE*ab values below 2.0 — specifically in yellow-green ink channels. Those are the failures that generate rework, shipment delays, and brand consistency complaints from end customers. The instrument measurement did not prevent those failures in isolation; it was the combination of instrument data and understanding of perceptual sensitivity in specific color ranges that flagged the risk.
For practical color measurement of holographic prints against a standard, ISO 15397:2014 Printing inks — Determination of resistance to rubbing provides adjacent methodology context for surface durability of printed finishes on specialty substrates. For any holographic packaging destined for food-adjacent applications, the food safety compliance framework under EU Regulation No 10/2011 on plastic materials and articles intended to contact food may also apply to the laminate or coating layers, independent of the color measurement question.
Practical Guidance for Buyers #
Honestly, most buyers over-specify color tolerances on paper spec sheets and under-specify the measurement method used to verify them. A purchase order that says “ΔE*ab ≤ 2.0” without defining the spectrophotometer geometry, aperture size, number of measurement points, and measurement position relative to the grating direction is not a binding color specification — it is an invitation to a dispute.
When sourcing holographic-finish printed packaging — whether cigarette packs, cosmetics packaging solutions, or premium gift packaging solutions — the measurement protocol needs to be defined before sampling, not after a batch arrives. At minimum, the following should be agreed with your supplier: (1) spectrophotometer model and aperture, (2) SCI vs. SCE mode, (3) whether row-column or rotation method applies, (4) number of sample points and intervals, and (5) which stage of production the acceptance test applies to — substrate incoming, semi-finished, or finished print.
We produce holographic and specialty-finish packaging for brand owners across multiple industries, from tobacco security packaging to premium consumer goods — and the color consistency standards described here reflect the kind of documented measurement protocols we apply in production and sampling. Establishing measurement method agreement upfront is exactly what makes sampling reviews productive instead of contentious.
Need a custom formulation or sample? Request a quote from our team →
Supplier Qualification Questions #
- What spectrophotometer model and aperture size does your color measurement system use for holographic substrates, and do you operate in SCI (specular component included) or SCE mode?
- When measuring holographic paper or holographic-printed products, how many sampling points do you use, and what is the interval — specifically, can you demonstrate a row-column scan of at least 10 points at 5 mm intervals or 17 points at 3 mm intervals across the grating direction?
- For finished prints with limited uniform-color zones, do you use a fixed-point rotation protocol, and if so, what is your angular increment and point count — and how do you adjust your ΔE*ab acceptance threshold when rotation measurement is used instead of linear scanning?
- What is your documented acceptance threshold for ΔEab on holographic substrates at each production stage (raw substrate, semi-finished, finished print), and do you apply a modified threshold (e.g., ΔEab ≤ 3.0) for metallic finishes like gold measured by rotation method?
- How do you manage and validate your color reference standard condition over time — specifically, what is your protocol for detecting and replacing worn or abraded reference standards that would otherwise cause false-fail measurements like the scenario where ΔE*ab values of 2.16–3.12 were traced to reference standard surface damage rather than substrate defect?
Quality Verification Checklist #
- ☐ Supplier’s spectrophotometer operates with integrating sphere geometry and SCI mode, aperture ≤ 4 mm, confirmed by instrument calibration certificate
- ☐ Row-column scan protocol uses minimum 10 sampling points at 5 mm intervals (or 17 points at 3 mm), measured perpendicular to grating light-column direction across a minimum 50 mm cycle
- ☐ ΔE*ab acceptance threshold is defined per production stage: ≤ 2.0 for raw substrate and semi-finished prints, ≤ 2.5 for finished prints (row-column method)
- ☐ For gold, silver, or metallic-finish samples measured by fixed-point rotation, supplier applies a documented relaxed threshold of ≤ 3.0 ΔE*ab with justification on record
- ☐ Yellow-green ink channels are subject to tighter internal acceptance limit of ΔE*ab ≤ 1.5 based on elevated human perceptual sensitivity in that gamut zone
- ☐ Reference standards are visually and instrumentally inspected for surface abrasion at each measurement session; replacement protocol is documented and dated
- ☐ Platform or measurement stage positioning accuracy is ≤ 5 mm, verified by mechanical calibration log
- ☐ Measurement results are cross-validated by trained visual evaluation under standard D50 or equivalent illuminant conditions for all semi-finished and finished print acceptance decisions
Key Specifications Table #
| Parameter | Recommended Value | Verification Method |
|---|---|---|
| Color difference acceptance — raw holographic substrate | ΔE*ab ≤ 2.0 | Row-column scan, 17 pts × 3 mm, SCI integrating sphere |
| Color difference acceptance — semi-finished print | ΔE*ab ≤ 2.0 | Row-column scan, 17 pts × 3 mm or 10 pts × 5 mm |
| Color difference acceptance — finished print (row-column) | ΔE*ab ≤ 2.5 | Row-column scan, 17 pts × 3 mm, SCI mode |
| Color difference acceptance — metallic finish (rotation method) | ΔE*ab ≤ 3.0 | Fixed-point rotation, 7 pts × 30°, SCI integrating sphere |
| Yellow-green perceptual sensitivity zone — tighter threshold | ΔE*ab ≤ 1.5 recommended | Row-column scan + parallel visual evaluation |
| Platform positioning accuracy | ≤ 5 mm | Mechanical calibration log |
| Measurement aperture (X-Rite Ci64) | 4 mm | Instrument specification and calibration certificate |
| Scan coverage per light-column cycle | Minimum 50 mm | Confirmed by sampling interval × point count ≥ 50 mm |
Looking for a manufacturer that meets these specs? Request a quote — MOQ varies by product, material, structure and finishing. Product-specific MOQ is confirmed with each quotation.
References #
Data source: Multi-Point Colorimetric Evaluation of Holographic Substrates and Their Printed Products Using an Automated Measurement Platform, K. Zeng et al., Journal of Applied Polymer Science, 2023
Frequently Asked Questions #
Why does a single-point spectrophotometer measurement fail on holographic paper?
Holographic (laser) paper uses a surface diffraction grating that scatters incident light at angle-dependent wavelengths. A single measurement point captures only the color response at one specific orientation, which may be significantly different from readings at adjacent points or after sample rotation. Multi-point scanning — either linear or rotational — is necessary to characterize the substrate’s overall colorimetric behavior and produce a stable, reproducible ΔE*ab value that reflects the full light-column cycle.
What ΔE*ab threshold should I write into a holographic print purchase specification?
It depends on the production stage and measurement method. Based on validated production data: ΔEab ≤ 2.0 for raw holographic substrate and semi-finished prints using row-column scanning; ΔEab ≤ 2.5 for finished prints using the same method. If your supplier uses fixed-point rotation (common where graphic elements prevent linear scanning), allow up to ΔE*ab ≤ 3.0 for metallic finishes — but require documentation that the relaxed threshold is method-specific, not a blanket relaxation.
Can trained visual evaluation replace instrument measurement for holographic print QC?
No — and the data is unambiguous on this. Visual evaluation could not be conducted at all on unprinted holographic substrates because the rainbow/light-column optical effect makes stable human color perception impossible. For semi-finished and finished prints, visual results correlated strongly with instrument data overall, but three specimens with ΔEab values just below 2.0 were still rated unacceptable by trained evaluators — specifically in yellow-green color zones where human perceptual sensitivity exceeds what the ΔEab formula captures.
What caused the false-failure result on No.12 substrate, and how was it identified?
The No.12 substrate initially returned ΔE*ab values of 2.16, 2.38, 3.12, 2.41, and 2.91 — all failures by the ≤ 2.0 threshold. Investigation showed the reference standard used for comparison had surface abrasion damage that was altering the baseline measurement. After replacing the worn reference, the same specimens measured 0.20, 0.72, 0.89, 0.85, and 2.16 — four of five now passing. This is a reference standard management issue, not a substrate defect, and it is one of the most common sources of spurious rejection in holographic print QC.
Why does fixed-point rotation method give consistently higher ΔE*ab readings than row-column scanning on the same sample?
Two reasons. First, the rotation method samples within a small spatial area, which amplifies local variance that linear scanning averages out across a larger region. Second, the 7-point rotation captures 7 angular positions within one light-column cycle compared to 17 measurement points in the row-column method — the lower sampling density increases statistical noise. The methods agree on pass/fail trend but the rotation method’s absolute values run higher, which is why a slightly relaxed threshold (≤ 3.0 for certain finishes) is appropriate when rotation is the only feasible protocol.
Published by ukugi.com Technical Team | Request a quote


