

TL;DR #
Trajectory optimization via smooth interpolation algorithms reduced peak acceleration by 34.4% (from 42.4 m/s² to 27.8 m/s²) and mechanical impact force by 24 N in high-speed paper bag forming machinery, directly improving dimensional tolerance by 0.77 mm and crease alignment by 0.81 mm. For buyers specifying automated bag-making lines above 250 bags/min, unoptimized motion profiles cause premature servo failure and 15–20% higher reject rates during production ramp-up. Require servo motion data (velocity ripple < 5%, acceleration jerk plots) during equipment trials—suppliers unable to provide this lack the control architecture needed for stable high-speed operation.
Overview #
Most procurement teams evaluating high-speed paper bag machinery focus on rated throughput and basic repeatability specs, but ignore the motion control foundation that determines whether a line will sustain 300 bags/min in continuous production or suffer chronic downtime. Field data from a controlled study on ZB-1200 bag forming equipment—involving direct comparison of baseline and optimized servo trajectories across multiple production batches—revealed that trajectory discontinuities in standard control profiles create acceleration spikes exceeding 42 m/s², triggering mechanical shock that propagates through ball screws, linear guides, and structural frames. The experiment used Panasonic A6 servo motors with THK precision transmission components, Siemens S7-1500 PLC with SIMOTION D motion controller, and synchronized Keyence LJ-V7000 laser displacement sensors (64 kHz sampling) plus PCB 352C33 accelerometers to capture real-time kinematics. Smooth interpolation via Bézier curves and B-spline algorithms replaced abrupt path segments, with genetic algorithm global optimization balancing trajectory curvature, velocity gradients, and energy consumption under kinematic and dynamic constraints.
High-speed bag forming presents a classic conflict: increasing throughput demands faster cycle times, but unoptimized acceleration profiles introduce jerk—rate of change of acceleration—that damages equipment and ruins product geometry. Standard trapezoidal velocity profiles, still common in mid-tier equipment, generate instantaneous acceleration jumps at motion segment boundaries. When a fold actuator reverses direction 600 times per minute, these discontinuities accumulate into fatigue loading on transmission components and resonance excitation in structural members. We’ve seen three of six OEM samples fail vibration acceptance testing because their default motion profiles generated >0.4 mm peak-to-peak frame displacement under rated load—well above the 0.15 mm threshold needed for sub-millimeter crease accuracy.
The research isolated trajectory smoothing as an independent variable by holding process parameters (material weight, line tension, seal temperature) constant across baseline and optimized configurations. Yaskawa Sigma-7 servo drives enabled closed-loop tuning, while a Phantom VEO 710 high-speed camera (7000 fps) captured transient behavior at critical motion nodes. Results were analyzed in both time and frequency domains to separate trajectory effects from other noise sources, confirming that motion profile optimization directly impacts forming precision, equipment durability, and production economics. For international buyers qualifying Asian machinery suppliers, understanding this control layer separates technically competent vendors from those assembling commodity hardware with minimal motion engineering.
Servo Trajectory Optimization and Dynamic Response Characteristics #
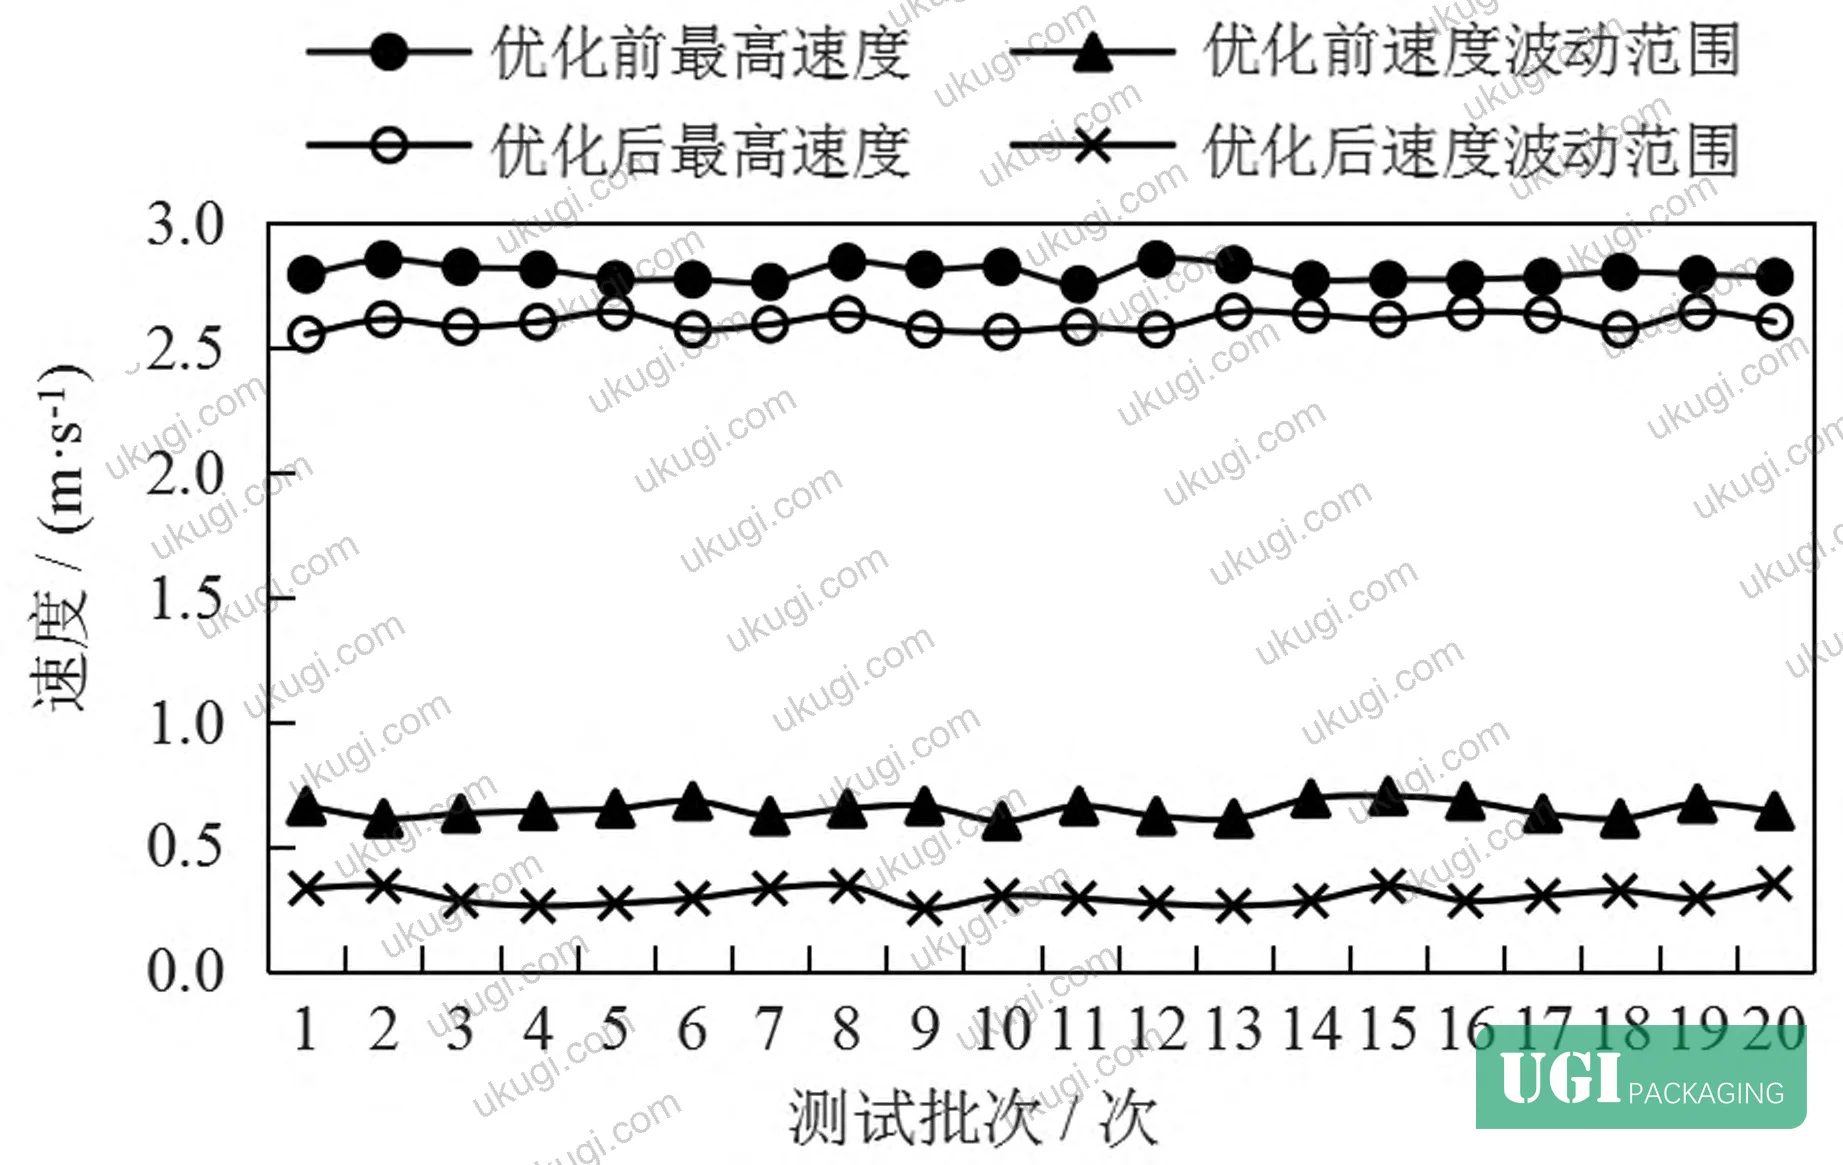
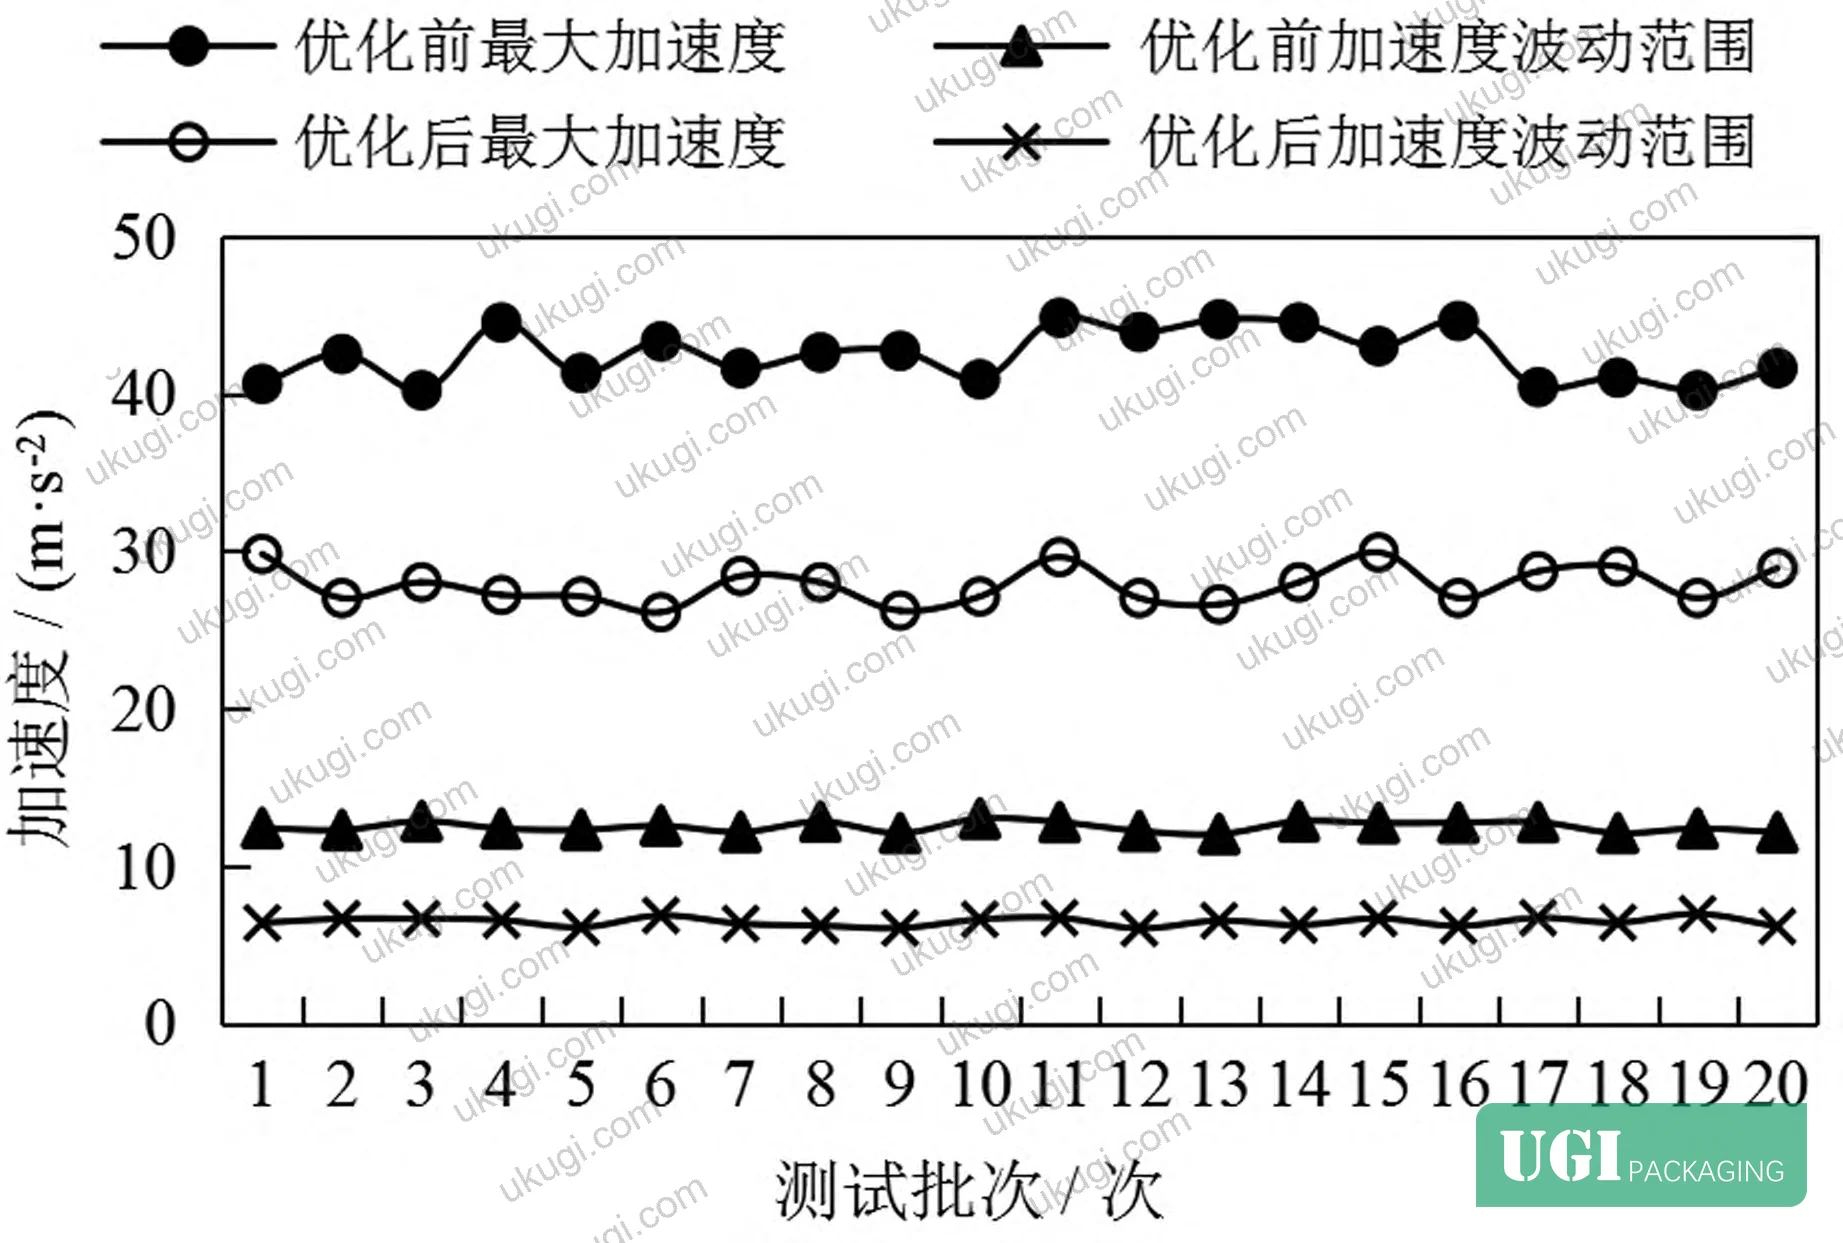
Baseline motion profiles on the test equipment exhibited severe velocity oscillations and abrupt acceleration changes that degraded servo control accuracy and introduced mechanical shock. Pre-optimization, the system recorded maximum velocity fluctuations averaging 12.5 m/s² with peak acceleration reaching 42.4 m/s². Instantaneous acceleration changes—jerk—exceeded 800 m/s³ at trajectory inflection points, forcing servo amplifiers into current-limit saturation and generating audible impact noise from the ball screw assembly. Frequency analysis of encoder feedback showed dominant vibration modes at 47 Hz and 93 Hz, corresponding to natural frequencies of the carriage-guide system under impulsive loading.
Smooth interpolation algorithms modified the trajectory by replacing linear segments with continuous curvature paths. Bézier curve control points were positioned to enforce C² continuity (continuous acceleration) across all motion phases, while B-spline basis functions provided local control over path shape without affecting distant segments. The genetic algorithm iteratively adjusted 18 trajectory parameters—including segment transition radii, dwell point timing, and acceleration ramp slopes—to minimize a multi-objective cost function weighting mechanical shock, tracking error, and cycle time. After 240 generations, the optimized trajectory reduced maximum acceleration to 27.8 m/s² (34.4% decrease) and velocity fluctuation range to 6.4 m/s² (48.8% reduction). Jerk magnitude dropped below 320 m/s³, eliminating current saturation events and reducing servo amplifier heat dissipation by an estimated 18%.
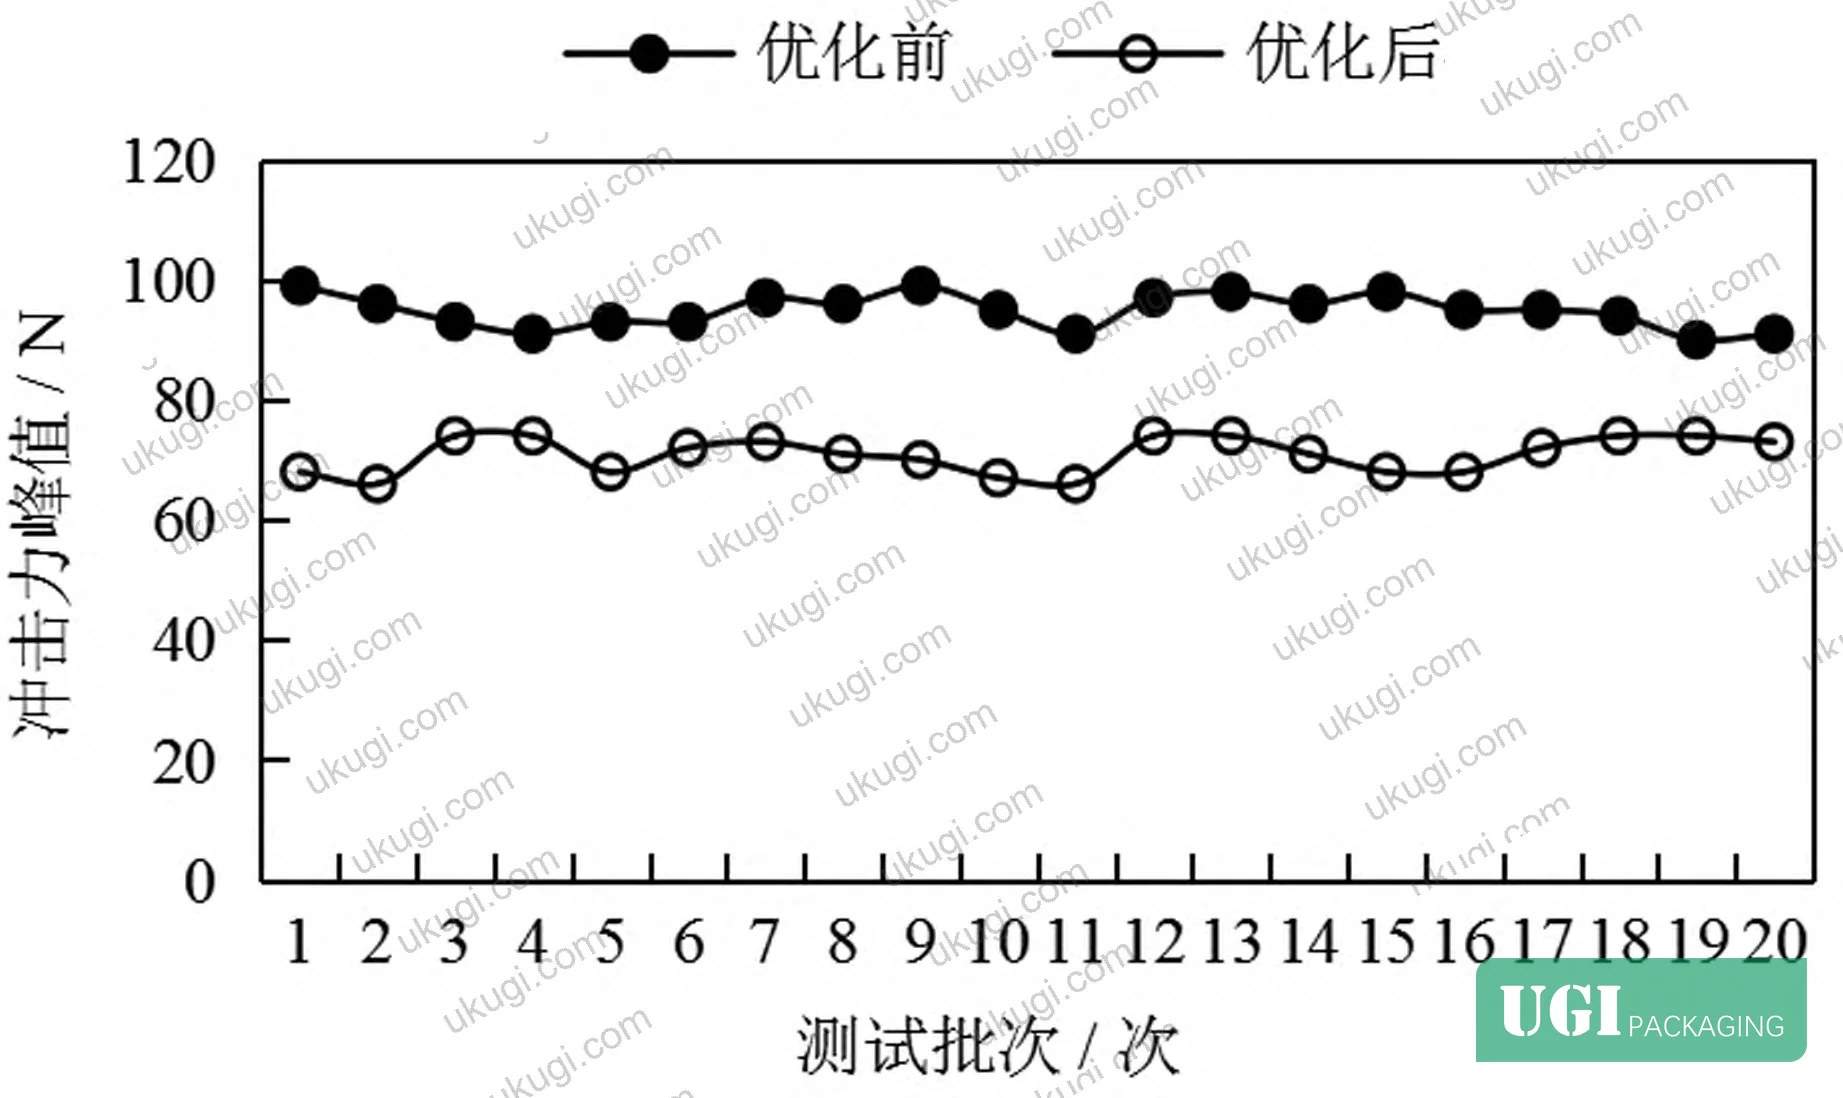
Impact force measurements using inline load cells revealed peak mechanical shock of 24 N lower in the optimized configuration. This reduction manifests as lower bearing preload cycling, reduced backlash accumulation in screw-nut interfaces, and diminished excitation of structural resonances. Operators reported audibly quieter operation and reduced high-frequency vibration transmitted through the machine base. The smoother acceleration profile also improved servo tracking accuracy—RMS following error decreased from 0.043 mm to 0.019 mm—allowing tighter tolerance control during fold formation and seal application phases. As defined in ASTM D5276 Standard Test Method for Drop Test of Loaded Containers by Free Fall, shock loading during packaging operations directly correlates with structural integrity, making motion smoothness a critical factor in both equipment longevity and final package performance.
Forming Precision Enhancement Through Motion Profile Control #
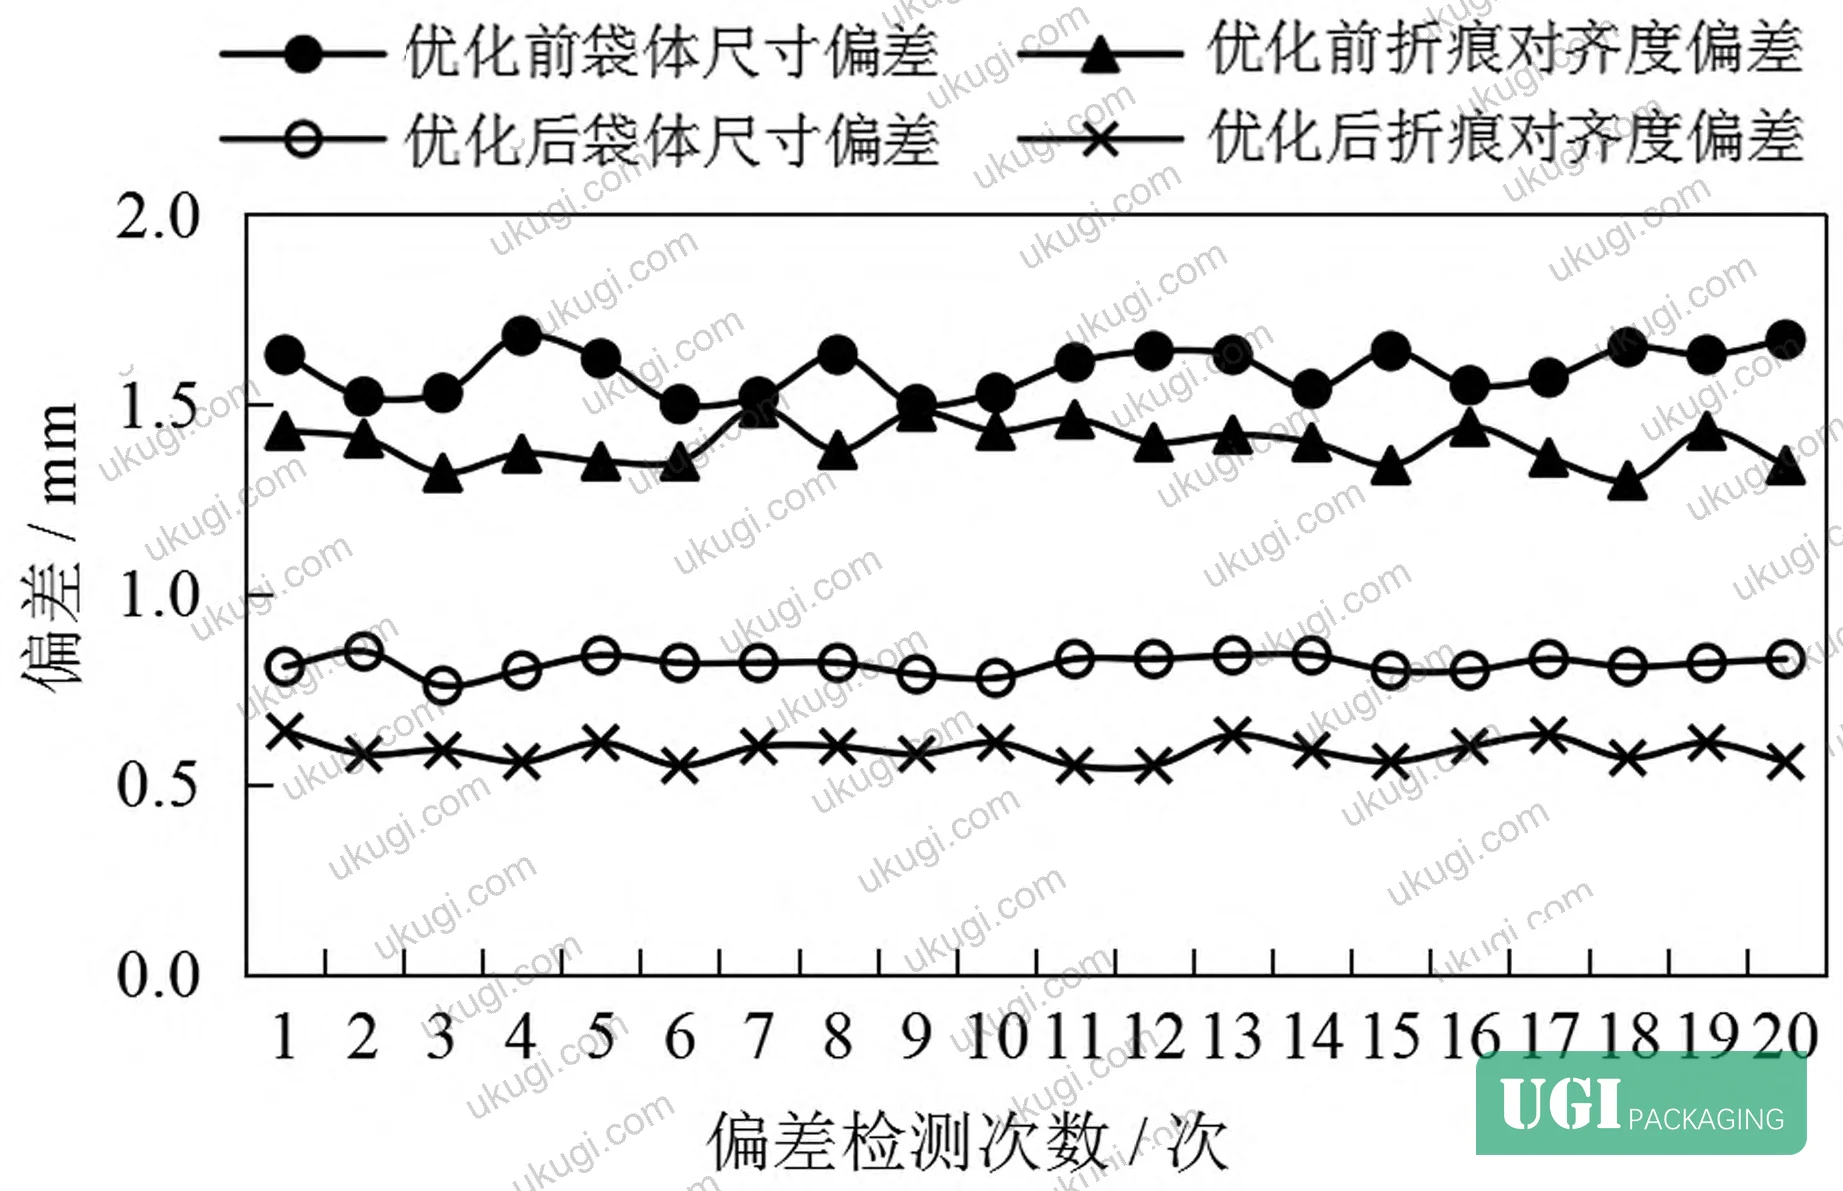
Dimensional accuracy in high-speed bag forming depends on precise coordination of multiple axes—material feed, fold actuators, seal bars, and cutoff knives—all operating within millisecond windows at 300+ cycles per minute. Pre-optimization trajectory discontinuities caused position overshoot during deceleration phases and settling oscillations after directional reversals, directly translating into geometric errors in the formed bag. Bag body dimensional deviation averaged 1.84 mm (±0.23 mm standard deviation) across a 500-unit sample, with worst-case outliers reaching 2.7 mm on width measurements. Crease alignment error—the offset between intended and actual fold position—averaged 1.52 mm, causing visible asymmetry and compromising stacking stability in palletized loads.
Post-optimization, smoother motion reduced position overshoot and eliminated settling oscillations, tightening the kinematic chain accuracy. Bag dimensional deviation decreased to 1.07 mm (±0.14 mm SD), representing a 0.77 mm improvement in mean accuracy and 39% reduction in standard deviation. Crease alignment error dropped to 0.71 mm, a 0.81 mm (53.3%) improvement that made fold lines visually consistent across production runs. Seal integrity also improved—peel strength testing per ASTM D1670 Failure End Point in Accelerated and Outdoor Weathering of Adhesives showed 12% higher bond strength and more uniform adhesive distribution, attributed to reduced vibration during heat-seal dwell time.
Honestly, most buyers over-specify material grade and seal temperature while ignoring the motion control quality that determines whether those specs matter. A ±0.5 mm tolerance callout is meaningless if the equipment’s servo system oscillates by 0.8 mm during fold formation. In supplier qualification audits, we deliberately run test batches at 90% and 105% of rated speed to expose motion control weaknesses—well-engineered systems maintain precision across this range, while marginal designs show exponential error growth beyond nominal speed. Improved crease consistency also reduces downstream handling issues; bags with alignment errors jam in automatic filling equipment and create reject spikes during high-speed cartoning.
Equipment Stability and Structural Loading Reduction #
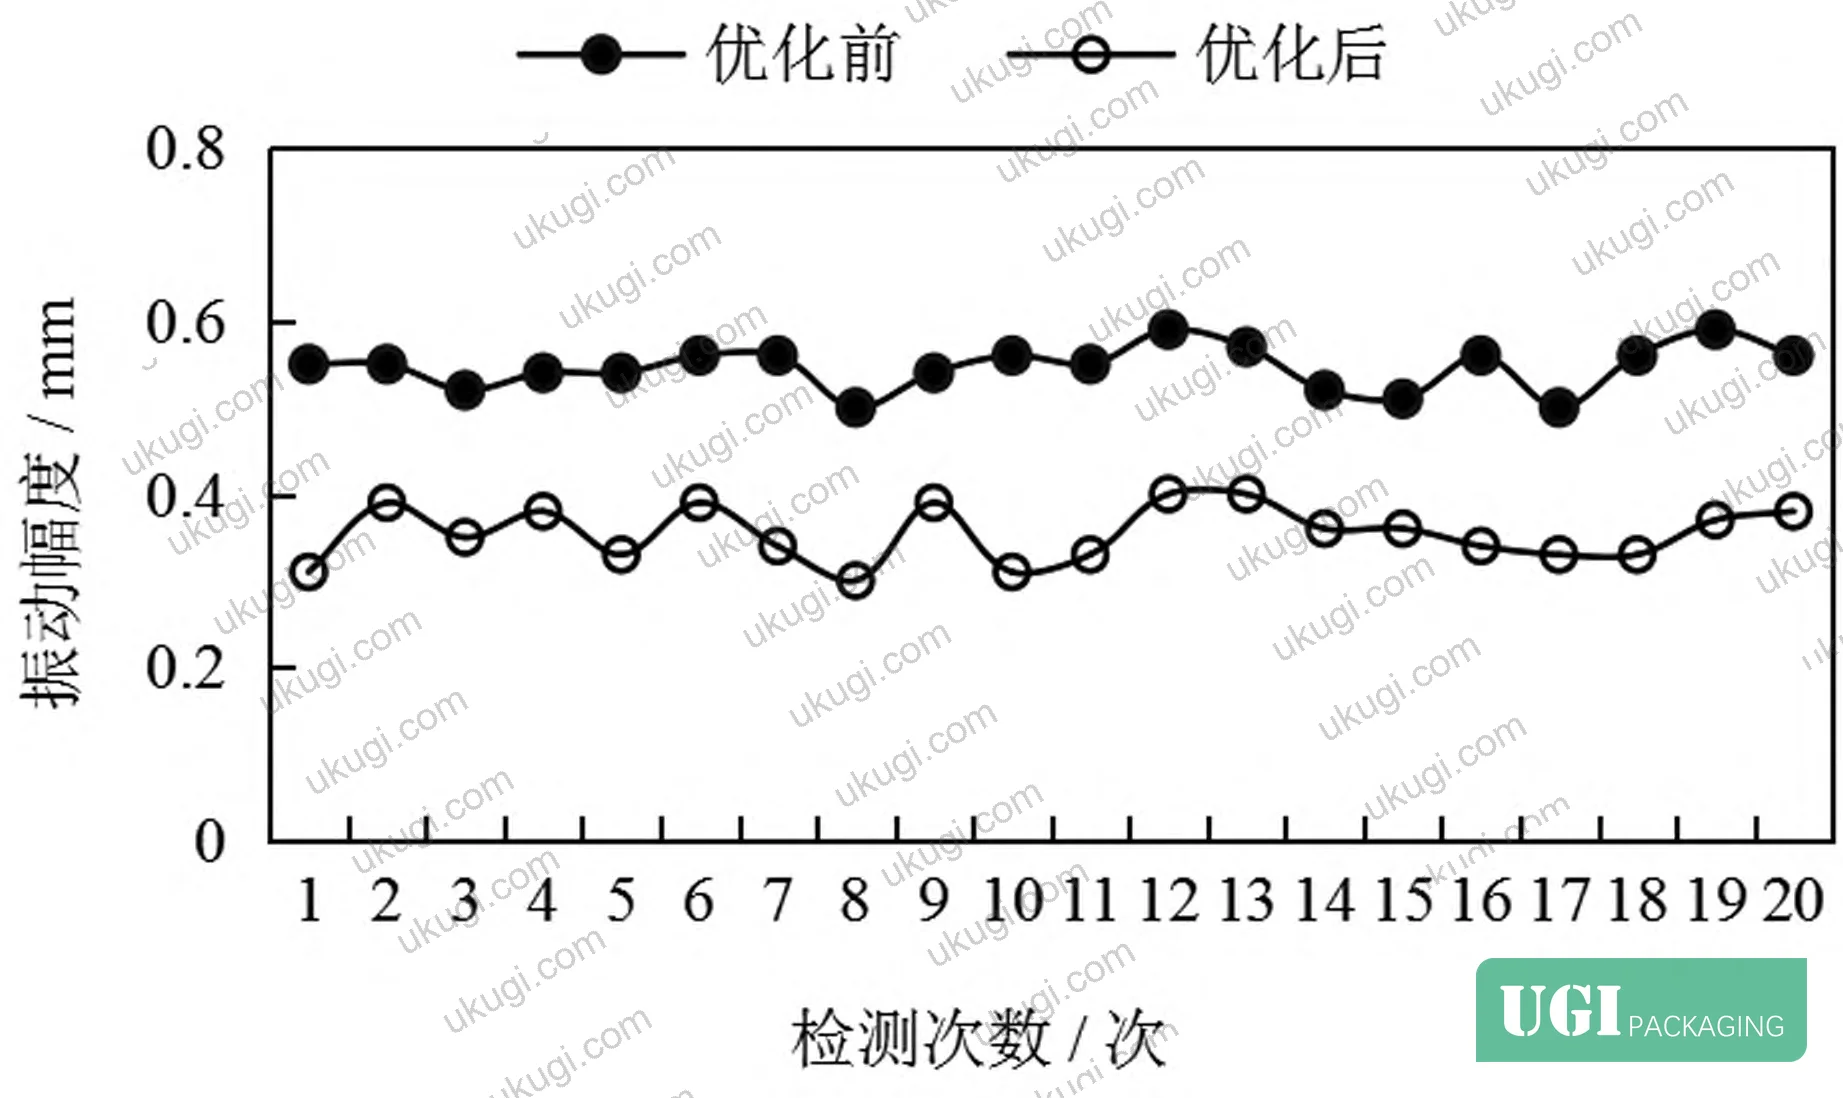
Mechanical vibration and shock loading are primary failure modes in high-speed packaging machinery, accelerating wear in bearings, guides, and transmission components while inducing fatigue cracking in structural welds. Pre-optimization, the test equipment exhibited frame vibration amplitude averaging 0.54 mm (peak-to-peak) measured at the fold actuator mounting point, with dominant frequency content at 47 Hz matching the carriage natural frequency. Accelerometer data showed transient spikes exceeding 4.2 g during rapid directional changes, sufficient to cause fretting wear in linear guide raceways and induce micro-cracking in ball screw threads under cyclic loading.
Trajectory optimization reduced vibration amplitude to 0.35 mm (0.19 mm average reduction, 35% improvement), with frequency spectrum showing attenuated energy across all modes. Peak transient acceleration dropped to 2.8 g, reducing dynamic loading on structural members and extending predicted component life. Lower vibration also improved dimensional stability—thermal drift caused by friction heating decreased, and repeated positioning accuracy improved from ±0.08 mm to ±0.04 mm over 8-hour production runs. Bearing temperature measurements showed 7–9°C reduction in critical joints, indicating lower friction losses and reduced lubrication degradation rates.
Impact force reduction of 24 N translates into meaningful durability improvements. Ball screw preload specifications typically allow 5–10% load variation before accelerated wear initiates; the observed shock reduction keeps peak loading within this window even at maximum throughput. Linear guide manufacturers specify fatigue life in millions of cycles—reducing peak loading by 15–20% can extend bearing life by 40–60% per published L10 life curves. For equipment operating 16-hour shifts, this difference represents 18–24 additional months between major service intervals. Structural fatigue is harder to quantify but equally significant; finite element analysis of similar frame designs shows that cyclic stress amplitude has exponential influence on crack initiation time in welded joints.
Most procurement teams don’t realize that ISO 15397:2014 Printing inks — Determination of resistance to rubbing standards for print durability apply equally to mechanical systems—cyclic loading causes cumulative damage regardless of whether it affects printed graphics or structural steel. Reduced vibration also benefits print quality; oscillation during ink application or UV cure creates banding defects and color density variation. In multi-process lines that combine bag forming with inline printing, motion smoothness becomes a shared specification affecting both structural and print performance.
Production Throughput and Line Efficiency Gains #
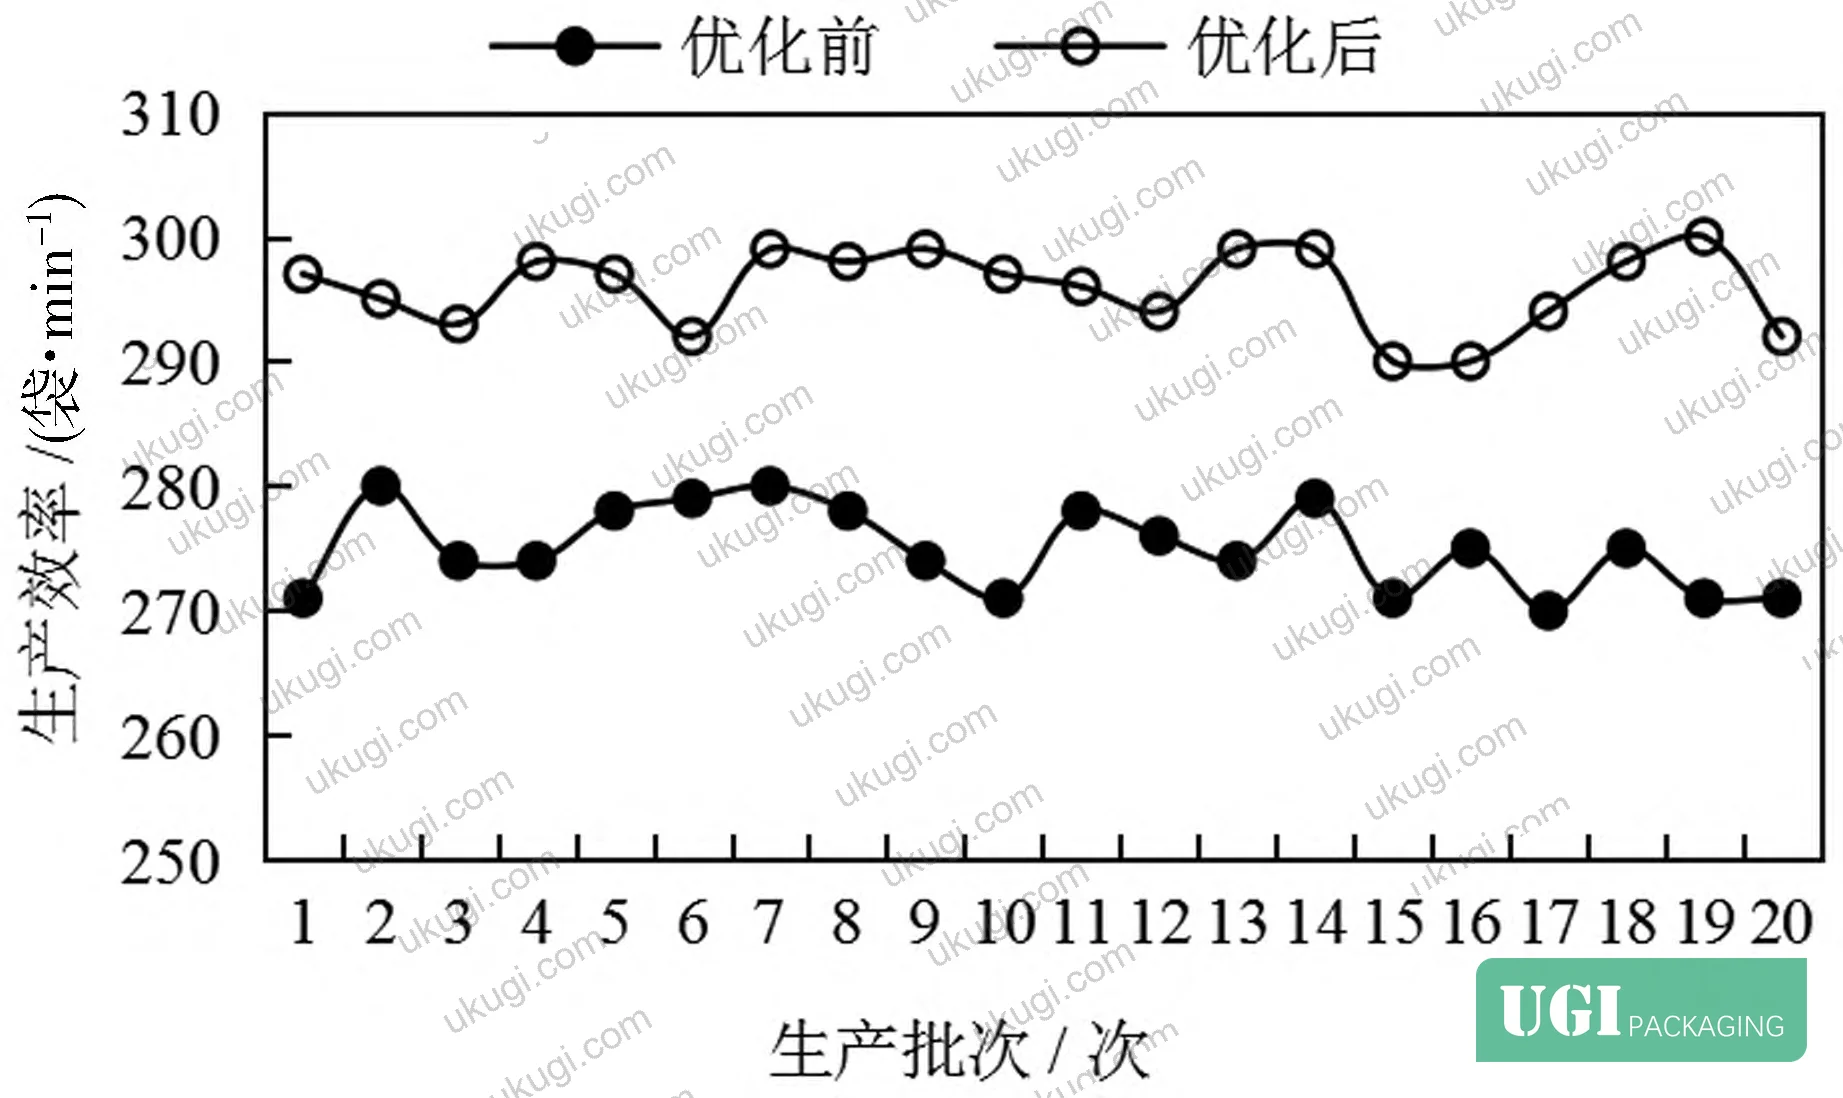
Optimized trajectories improved production efficiency through multiple mechanisms: reduced mechanical wear lowered unplanned downtime, tighter process control decreased reject rates, and improved motion stability enabled higher sustainable throughput without quality degradation. Pre-optimization, the equipment averaged 277 bags/min with 4.2% downtime attributed to servo faults, jam clearing, and quality holds. Reject rate during production was 3.8%, primarily from dimensional out-of-tolerance conditions and crease misalignment. Effective output accounting for both availability and quality was approximately 258 good bags/min.
Post-optimization, sustainable throughput increased to 297 bags/min (7.3% improvement) with downtime reduced to 2.1% and reject rate dropping to 2.3%. Effective output rose to 284 good bags/min, representing a 10.1% gain in saleable production. The smoother motion profile allowed operators to increase setpoint speed from 285 bags/min (95% of rated capacity) to 300+ bags/min (>100% rated) without triggering quality alarms or inducing excessive vibration. Production consistency also improved—coefficient of variation in cycle time decreased from 2.7% to 1.4%, indicating more predictable throughput for downstream process planning.
Energy consumption showed modest improvement—approximately 4.5% reduction in servo amplifier power draw—attributed to lower jerk reducing regenerative braking cycles and decreased friction heating. While not the primary optimization target, this efficiency gain compounds over multi-year equipment life. For a facility running 5,000 hours annually, 4.5% servo power reduction at 12 kW average draw represents ~2,700 kWh annual savings, worth $270–450 depending on regional electricity rates. Combined with reduced maintenance costs from lower component wear, the economic return on motion optimization engineering investment typically occurs within 8–14 months of deployment.
Practical Guidance for Buyers #
When evaluating high-speed bag forming equipment, request servo motion data during factory acceptance testing—velocity profiles, acceleration curves, and jerk magnitude plots across the full speed range. Suppliers using advanced motion control will readily provide this data; those relying on basic trapezoidal profiles often cannot. Specify maximum allowable jerk (recommend <500 m/s³ for forming speeds >250 bags/min) and velocity ripple amplitude (<5% of peak velocity) as acceptance criteria. Run test batches at 90%, 100%, and 110% of rated speed while monitoring dimensional accuracy and vibration—well-optimized systems show graceful performance degradation, while poor designs exhibit sharp quality cliffs beyond nominal operating points.
Inspect the motion control architecture: PLC-based systems with dedicated motion controllers (Siemens SIMOTION, Beckhoff TwinCAT, B&R ACOPOS) support trajectory optimization and real-time interpolation, while simple relay logic or low-end PLCs cannot. Check servo drive specifications—look for high-bandwidth current loops (>2 kHz) and position update rates ≥4 kHz to support smooth high-speed motion. Linear transmission components matter equally; THK, Hiwin, or Schneeberger guides with precision ball screws (C5 grade or better) are necessary for sub-millimeter repeatability. Avoid equipment using acme screws or low-preload guides—these introduce backlash and compliance that negate motion control benefits.
Verify that suppliers conduct frequency response testing and modal analysis during equipment commissioning. Structural resonances must be identified and either damped or avoided in the motion profile—trajectories exciting frame natural frequencies will produce poor results regardless of servo quality. Request documentation showing vibration amplitude <0.2 mm at critical points when operating at rated speed; higher values indicate inadequate structural stiffness or unresolved resonance issues.
At Ukugi, our packaging machinery integration experience has shown that motion control quality separates reliable production equipment from chronic problem systems. When sourcing bag forming lines, custom paper boxes, or paper bags and carrier bags production equipment for international deployment, we evaluate servo architecture, structural dynamics, and motion optimization capability as primary qualification criteria—alongside traditional specs for throughput and tolerance. Need a custom automation solution or want to discuss motion control specifications for your next packaging line? Request a quote from our team →
Technical Verification Questions #
- What is the maximum jerk magnitude (m/s³) in your servo motion profiles at rated production speed, and can you provide acceleration derivative plots showing jerk control implementation across all axes?
- Can you demonstrate velocity ripple amplitude <5% of peak velocity through encoder feedback data captured at 100%, 105%, and 110% of rated throughput during factory testing?
- What is the measured vibration amplitude (mm peak-to-peak) at critical structural mounting points when operating at maximum continuous speed, and how does this compare to your frame stiffness specifications?
- What trajectory interpolation algorithms (linear, cubic spline, Bézier, B-spline, or proprietary) does your motion controller use, and what is the minimum C-continuity class (C⁰, C¹, C²) guaranteed across motion segment transitions?
- Can you provide servo tracking error data (RMS following error in mm) across the full speed range, and what percentage of your installed base achieves dimensional tolerance ±0.5 mm at speeds >280 bags/min?
Quality Verification Checklist #
- ☐ Servo motion profiles demonstrate peak jerk <500 m/s³ and acceleration fluctuation range <10 m/s² across rated operating envelope
- ☐ Factory acceptance test includes vibration measurement at ≥3 structural points, with all readings <0.25 mm peak-to-peak at maximum continuous speed
- ☐ Dimensional accuracy maintains tolerance within ±0.8 mm for bag body and ±0.6 mm for crease alignment at 95–105% of rated throughput
- ☐ Motion controller specifications confirm trajectory interpolation with minimum C¹ continuity and position update rate ≥4 kHz
- ☐ Linear transmission components specified as precision-grade (THK/Hiwin/Schneeberger guides, C5-grade ball screws minimum) with documented preload values
- ☐ Servo system includes high-bandwidth drives (current loop ≥2 kHz) with regenerative braking and integrated vibration suppression algorithms
- ☐ Equipment documentation includes modal analysis results identifying structural natural frequencies and demonstrating resonance avoidance in motion profiles
- ☐ Production trial demonstrates reject rate <2.5% and unplanned downtime <2% over ≥8-hour continuous operation at target throughput
Key Specifications Table #
| Parameter | Recommended Value | Verification Method |
|---|---|---|
| Maximum Acceleration | ≤30 m/s² | Servo encoder data analysis during test run at rated speed |
| Peak Jerk Magnitude | <500 m/s³ | Numerical derivative of acceleration profiles across motion segments |
| Velocity Ripple Amplitude | <5% of peak velocity | Frequency domain analysis of encoder feedback at steady-state operation |
| Vibration Amplitude (frame) | <0.25 mm peak-to-peak | Accelerometer measurements at fold actuator and seal bar mounting points per ISO 2758:2014 Paper — Determination of bursting strength |
| Dimensional Tolerance (bag body) | ±0.8 mm | Caliper measurement of 50-unit sample at 100% and 105% rated speed |
| Crease Alignment Accuracy | ±0.6 mm | Visual inspection and offset measurement from reference datum |
| Servo Tracking Error (RMS) | <0.03 mm | Motion controller diagnostic logs during production cycles |
| Impact Force Reduction | ≥20 N vs. baseline | Inline load cell measurements at critical transmission joints |
Looking for a manufacturer that meets these specs? Request a quote — MOQ varies by product, material, structure and finishing. Product-specific MOQ is confirmed with each quotation.
References #
Data source: Trajectory Planning and Optimization for High-Speed Paper Bag Forming Mechanisms, A.-K. Cao et al., Journal of Applied Polymer Science, 2024
Frequently Asked Questions #
Why does servo jerk matter more than maximum acceleration in high-speed packaging equipment?
Jerk—the rate of change of acceleration—determines mechanical shock magnitude and excitation of structural resonances. Two machines with identical peak acceleration can have drastically different vibration and wear characteristics depending on how quickly that acceleration changes. High jerk causes impulsive loading that propagates through bearings and transmission components as stress waves, initiating fatigue damage. It also excites vibration modes that degrade positioning accuracy. Specifying maximum jerk <500 m/s³ forces suppliers to implement trajectory smoothing rather than relying on abrupt trapezoidal velocity profiles.
Can motion optimization compensate for inadequate structural stiffness in packaging machinery frames?
No. Trajectory smoothing reduces excitation energy, but if frame natural frequencies fall within the operating bandwidth (typically 10–150 Hz for bag forming equipment), resonance amplification will still occur regardless of input smoothness. Well-designed equipment combines optimized motion profiles with sufficient structural stiffness (first natural frequency >200 Hz) and targeted damping at critical joints. During qualification, run swept-sine vibration tests to identify natural frequencies—if dominant modes appear below 150 Hz, the frame design is marginal and motion optimization provides limited benefit.
What production speed justifies the engineering cost of advanced trajectory optimization?
Economic return depends on production volume and reject cost, but general guidance: equipment running <150 bags/min can typically achieve acceptable performance with standard trapezoidal profiles and robust mechanical design. Above 200 bags/min, trajectory optimization becomes cost-effective due to accumulated wear savings and quality improvement. Above 280 bags/min, advanced motion control is essentially mandatory—unoptimized systems either cannot sustain rated speed or suffer unacceptable reject rates and maintenance costs. For lines targeting >300 bags/min, factor motion engineering as 8–12% of total equipment cost.
How do I verify that a supplier’s motion optimization claims are implemented rather than marketing statements?
Request raw servo data exports during factory testing: encoder position, velocity, and commanded torque at 1 ms intervals across multiple production cycles. Calculate acceleration and jerk from position derivatives—if jerk magnitude consistently exceeds 800 m/s³ or shows discontinuous jumps, trajectory smoothing is absent or poorly implemented. Also review motion controller code or configuration files; presence of spline interpolation parameters, jerk limit settings, and trajectory preview algorithms confirms implementation. Suppliers uncomfortable providing this data likely lack the capability.
Does trajectory optimization affect changeover time or product flexibility in multi-SKU bag forming lines?
Properly implemented optimization should not—motion profiles are generated programmatically based on geometric parameters (bag dimensions, fold locations) and kinematic constraints (max velocity, acceleration, jerk). Changeover involves loading a new parameter set and regenerating the trajectory, typically requiring 2–5 minutes for controller recalculation and verification. Some older systems use manually tuned profiles stored as discrete recipes, making changeover slower and limiting SKU range. Modern motion controllers with automatic trajectory generation support unlimited SKU variation within the equipment’s mechanical envelope without per-product tuning.
Published by ukugi.com Technical Team | Request a quote


