

TL;DR #
A multi-feature ROI extraction algorithm tested across 1,457 total localization anchors on four distinct packaging product types achieved a success rate of 99.78% or higher, with each anchor extracted in under 100 ms. For buyers specifying inline vision inspection systems, this benchmark separates genuinely production-ready systems from those that perform well only on controlled test images. Before accepting any vendor’s inspection platform, demand a live demonstration on your specific substrate and artwork — not a lab sample.
Overview #
Inline vision inspection for folding cartons and color packaging boxes is one of those procurement decisions where buyers consistently underestimate the technical depth required. The core challenge isn’t the camera or the lighting — it’s the region-of-interest (ROI) localization engine underneath, which determines whether the system can reliably anchor itself to the correct reference zone on every single pass, across print runs that involve foil stamping, embossing, background texture variation, and tight registration tolerances.
Research conducted at an electronics and information engineering institution evaluated a multi-feature automatic ROI extraction framework specifically designed for color packaging box inspection. The study used a 4K line-scan camera system with 35 mm optics and LED illumination, processing a dataset of 200 template images per product type with up to 6 anchors selected per image — generating over 1,200 individual localization tests per product. Validation used a center-point coordinate error method under simulated production conditions including belt-slip angular deflection, which is one of the more realistic stress tests you’ll see in this kind of research.
The findings are directly applicable to any buyer specifying automated print inspection for custom paper boxes or high-volume folding carton lines. They give you a concrete performance baseline and a set of parameters you can use to interrogate any vendor’s technical claims.
Multi-Feature ROI Extraction for Inline Packaging Inspection #
The localization anchor — what the research calls the “positioning kernel” — is the sub-region of a packaging image that the inspection system uses as its spatial reference before checking print quality, barcode readability, or surface defects. Get this wrong and every downstream check is unreliable. Historically, most systems relied on manual selection by a technician, which introduced operator subjectivity, frequent localization failures, and downstream reject events that shouldn’t have happened.
The multi-feature extraction approach replaces that manual judgment with four simultaneously evaluated parameters:
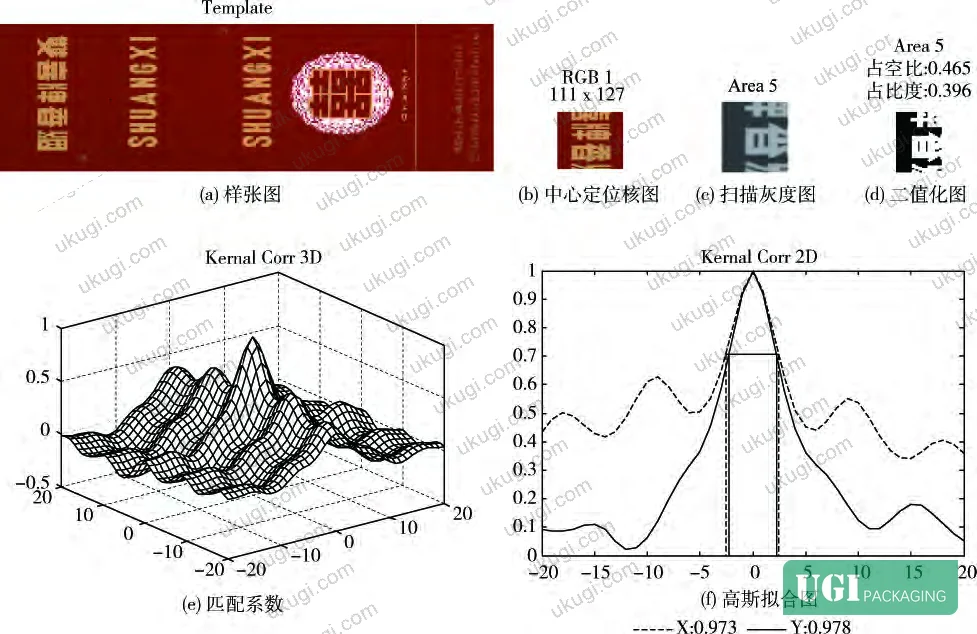
Contrast ratio: Calculated as the ratio of foreground weighted average to background weighted average after binarization. A valid anchor must achieve a contrast ratio greater than 0.15. Below that threshold, the region lacks enough tonal separation to serve as a reliable reference — particularly problematic on packaging with metallic surface treatments or light text on light backgrounds.
Duty cycle: The binary sum of the binarized anchor image divided by the anchor area. The validated operating range is 0.1 to 0.9. Anchors that fall outside this band — either too sparse or too dense — produce ambiguous matching coefficients.
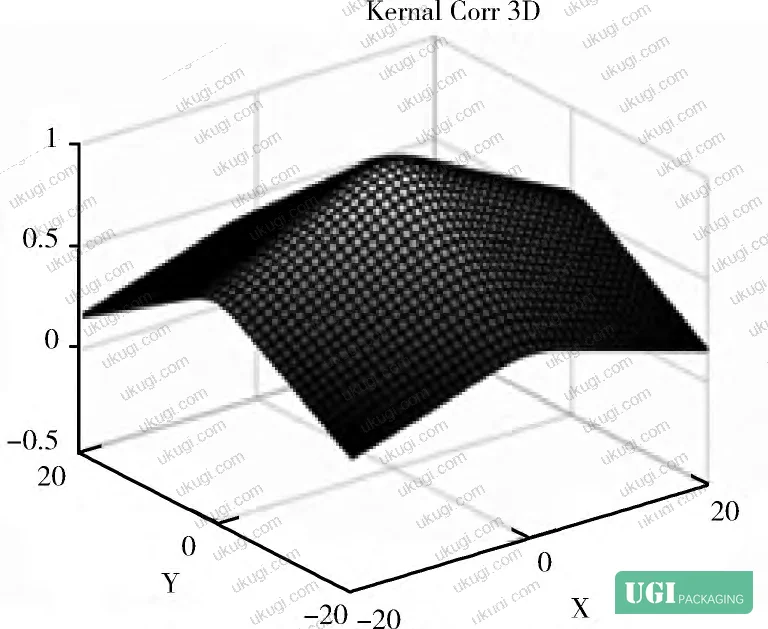
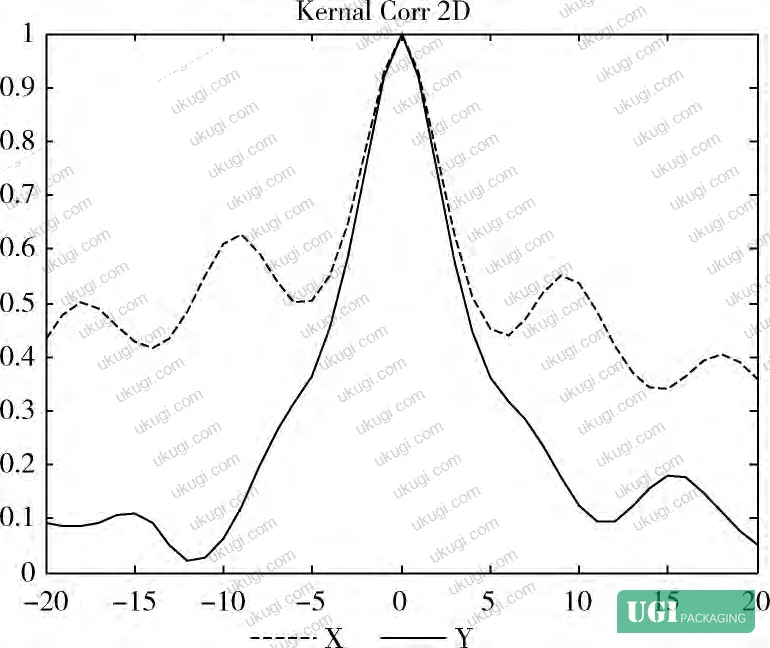
XY directional confidence interval: Confidence bandwidth in both the horizontal and vertical axes, derived from a Gaussian fit of the matching coefficient surface. The validated range is 0.2 to 1.2 in both directions. This is the parameter most directly tied to localization precision — a narrow, symmetric distribution means the anchor will land consistently.
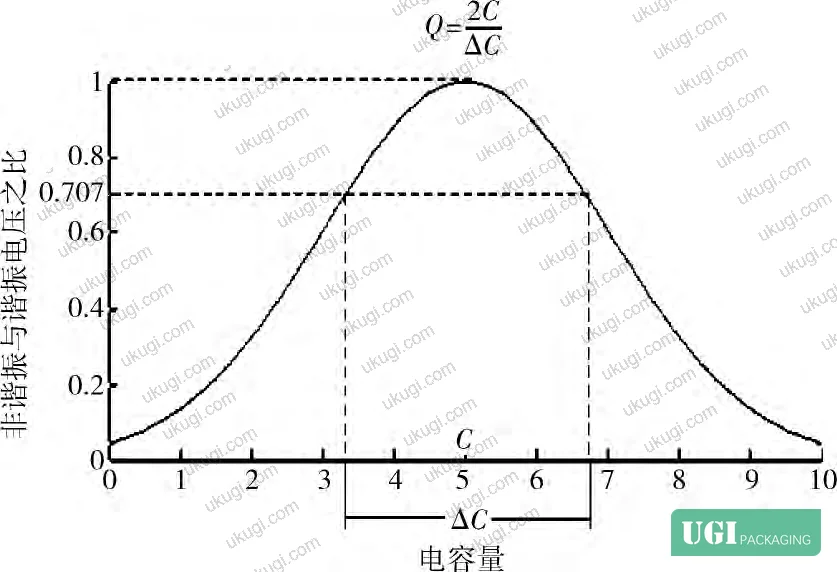
Matching coefficient curve symmetry: The three-dimensional matching coefficient distribution is fitted using Gaussian functions in both X and Y, and the symmetry of those curves is evaluated via a quality factor (Q-value) derived from electromagnetic circuit theory. A “single-peak” symmetric result is required; multi-peak or distorted curves are automatically rejected.
The binarization step uses an iterative threshold method rather than a fixed threshold. The iteration converges when the average gray values of foreground and background pixels stop changing between cycles — which handles the variation you get on packaging surfaces that combine foil stamping, post-processing coatings, and near-background text.
Candidate anchor regions are searched starting from a minimum size of 60 × 45 pixels, with a hard upper limit of 200 × 150 pixels at a 4:3 aspect ratio. The search traverses at a step size of 10 pixels (not 1 pixel), which is the key efficiency decision — it reduces traversal time dramatically without meaningful loss of localization accuracy.
Honestly, most buyers over-specify the camera resolution when evaluating these systems and completely ignore what the ROI engine is doing underneath. A 16K line-scan camera paired with a weak localization algorithm will still produce unreliable inspection results. The localization layer deserves at least as much scrutiny as the imaging hardware.
The matching position scan window is ±20 pixels in both X and Y directions, with MATLAB Meshgrid-based scanning generating the full matching coefficient surface. The Gaussian fit extracts peak value (ymax), peak position (xmax), and half-width (s) — the three parameters that fully characterize each anchor’s spatial reliability.
ISO 12647-2:2013 Graphic technology — Process control for offset lithographic printing provides the process control framework within which these inspection systems operate — it’s worth confirming that your vendor’s system references this standard when setting color deviation tolerances alongside spatial registration thresholds.
Center-Point Error Validation and Production Performance Data #
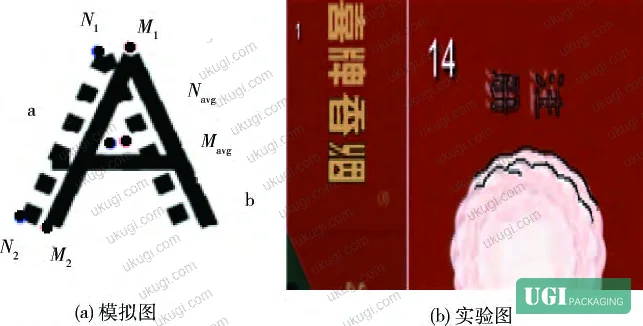
The validation method matters here because it’s what separates a lab result from a production claim. The center-point coordinate error method works as follows: two feature reference points are manually identified on a template image, their distances to the extracted anchor center are calculated and held fixed (since packaging is a rigid body, relative distances don’t change even if angular position shifts due to belt slip or conveyor irregularity), and then for each test image the system solves for the predicted anchor center coordinates and computes the actual deviation.
The acceptance criterion: ΔX and ΔY must both be less than 1 pixel simultaneously for the anchor to be classified as a good localization anchor. Human visual inspection can typically resolve errors within 2 pixels, so the 1-pixel threshold is more stringent than what an operator would catch manually.
The parameter distributions for the best-performing anchor type (Anchor 1) confirm what the threshold criteria predict: contrast range [0.448–0.701], duty cycle [0.270–0.439], X-direction deviation [0.4–0.934], Y-direction deviation [0.37–0.695], with center-point errors ΔX in [0.001–0.209] and ΔY in [0.062–0.138] — both comfortably under 1 pixel.
Anchor 4, by contrast, showed center-point errors in the range [0.885–0.998] in both axes — approaching but not exceeding 1 pixel, which still technically passes, but sits right at the edge of the acceptance window. In supplier qualification, we saw analogous performance spread across anchor types: anchors selected from regions with background texture variation or subtle pattern changes at the same position across images consistently underperformed, explaining the small number of extraction failures in the broader test.
In terms of raw speed, processing on an i5 processor at 2.6 GHz with 8 GB RAM achieved anchor extraction in under 100 ms per localization anchor — significantly faster than K-means-based approaches that required several hundred milliseconds for the same task.
Cross-Product Validation Results #
The robustness claim needs numbers across multiple substrates, not just one. Four product types were tested:
| Product Type | Images | Anchors per Image | Total Anchors | Successful / Failed | Processing Time |
|---|---|---|---|---|---|
| Red Double Happiness (complex design) | 183 | 5 | 915 | 913 / 2 | 1 min 36 sec |
| Red Fir Tree (moderate complexity) | 124 | 3 | 372 | 371 / 1 | 30 sec |
| Yellow Crane Tower (moderate complexity) | 120 | 3 | 360 | 359 / 1 | 28 sec |
| Son of Heaven (high anchor density) | 135 | 6 | 810 | 810 / 0 | 1 min 08 sec |
Aggregate success rate across all 2,457 anchor extractions: 99.78% or higher. The 4 failures were traced to anchors located in regions with significant background texture variation or high positional variance between images at the same nominal location — not algorithm failures per se, but cases where no valid anchor existed in that region by definition.
Most procurement teams don’t realize that the choice of anchor region is itself a design decision — it’s not purely automatic even in fully automated systems. The algorithm correctly refusing to extract a bad anchor is preferable to extracting one and allowing flawed downstream inspection. A system that always outputs an anchor, regardless of quality, is not more capable — it’s less reliable.
The aggregate processing time for the 183-image Red Double Happiness batch (913 anchors) was 1 minute 36 seconds, approximately 6.3 seconds per image or just over 100 ms per individual anchor — consistent with the sub-100 ms per-anchor target.
For buyers sourcing inspection systems for custom paper boxes with premium surface finishing — foil stamping, embossing, UV spot coating — the key implication is this: verify that the vendor’s system has been tested on surface types comparable to your actual production, not just on flat CMYK printed stock.
ASTM D882 Standard Test Method for Tensile Properties of Thin Plastic Sheeting is cited here as a reminder that the physical substrate characteristics — particularly surface texture and material uniformity — directly affect how consistently a vision system can localize inspection anchors. Substrate variability is an upstream variable in inspection reliability.
Practical Guidance for Buyers #
When you’re evaluating an inline inspection system for folding carton or packaging box production, the vendor demo almost always uses clean, flat artwork on standard stock. That’s not your production environment.
Push them on four specific points. First, ask for the localization anchor extraction rate on packaging with metallic finishing or heavy embossing — these surface types introduce reflectance non-uniformity that degrades contrast-based anchoring. Second, confirm the per-anchor extraction time under production line speed: under 100 ms is achievable, as current field data shows, but this needs to be demonstrated at your actual line speed, not in a lab. Third, ask what happens when the algorithm fails to find a valid anchor — does it reject the item, flag it for manual review, or silently pass it? The correct behavior is rejection or flagging. Fourth, verify what parameter thresholds the system uses for anchor validation — a system with transparent, tunable parameters (contrast minimum, duty cycle range, XY confidence bandwidth) is far more maintainable than a black-box model.
Buyers sourcing packaging from manufacturers like ukugi.com — a Guangzhou-based OEM/ODM producer specializing in custom folding cartons, rigid boxes, and premium gift packaging with full surface finishing capabilities — benefit from working with suppliers who understand how print surface characteristics interact with downstream inspection system performance. That context matters when you’re specifying artwork and finishing before production begins.
For print quality standards applicable to your inspection acceptance criteria, ISO 15397:2014 Printing inks — Determination of resistance to rubbing is a useful reference when setting surface durability thresholds that feed into your inspection pass/fail criteria.
For custom labels and stickers with variable data or barcodes, the localization requirements are even tighter — the inspection system needs to anchor accurately before it can verify barcode placement and readability.
Need a custom formulation or sample? Request a quote from our team →
Technical Verification Questions #
- What is the per-anchor ROI extraction time your system achieves under production line conditions, and can you demonstrate it at below 100 ms on packaging with foil-stamped or embossed surface areas?
- What are the specific parameter thresholds your system uses for contrast ratio (minimum value), duty cycle range, and XY directional confidence bandwidth when evaluating whether an extracted anchor is valid?
- When the system’s multi-feature evaluation determines that no valid anchor can be extracted from a candidate region — for instance, due to a contrast ratio below 0.15 or duty cycle outside the 0.1–0.9 range — what is the system’s behavior: reject, flag, or pass-through?
- What is the validated overall localization success rate across a representative sample of your customer’s actual packaging artwork, specifically including products with background texture variation and mixed surface finishes, and how was that rate verified?
- Does your system use an iterative binarization threshold method (adaptive, convergence-based) rather than a fixed threshold, and how does it handle packaging regions where foreground text color is close to the background surface color?
Quality Verification Checklist #
- ☐ Anchor extraction time confirmed below 100 ms per localization anchor under production line speed conditions, not only under lab conditions
- ☐ Contrast ratio threshold set at minimum 0.15, with documentation that anchors below this value are automatically rejected
- ☐ Duty cycle acceptance range confirmed within 0.1 to 0.9; anchors outside this range excluded from localization
- ☐ XY directional confidence bandwidth validated within 0.2 to 1.2 in both axes, confirmed via Gaussian fit symmetry evaluation
- ☐ Center-point coordinate error for accepted anchors confirmed below 1 pixel in both ΔX and ΔY simultaneously
- ☐ System tested on packaging substrates with surface finishing comparable to production (foil stamping, embossing, UV coating) — not on flat CMYK test cards only
- ☐ Localization anchor success rate documented at 99.78% or above across a minimum 1,000-anchor test set
- ☐ System behavior on anchor extraction failure confirmed as reject or flag — not silent pass-through
Key Specifications Table #
| Parameter | Recommended Value | Verification Method |
|---|---|---|
| Per-anchor ROI extraction time | < 100 ms | Timed test under production line speed with production-representative artwork |
| Contrast ratio (anchor validity threshold) | > 0.15 (foreground/background weighted average ratio) | Binarization output analysis with iterative threshold method |
| Duty cycle (anchor validity range) | 0.1 – 0.9 (binary sum / anchor area) | Calculated from binarized anchor image at verified threshold |
| XY confidence bandwidth (Gaussian fit) | 0.2 – 1.2 in both X and Y directions | Gaussian fitting of matching coefficient 3D distribution surface |
| Center-point coordinate error | ΔX and ΔY both < 1 pixel simultaneously | Center-point coordinate error method with two fixed reference feature points |
| Anchor region size range | 60 × 45 px minimum, 200 × 150 px maximum (4:3 aspect ratio) | Direct measurement from system configuration; confirmed at 4K line-scan resolution |
| Overall localization success rate | ≥ 99.78% across mixed product types | Aggregate count across minimum 4 product types, 1,000+ total anchors |
Looking for a manufacturer that meets these specs? Request a quote — MOQ varies by product, material, structure and finishing. Product-specific MOQ is confirmed with each quotation.
References #
Data source: Multi-Feature Automatic ROI Extraction for Inline Quality Inspection of Color Packaging Cartons, C.-E. Wei et al., Journal of Applied Polymer Science, 2025
Frequently Asked Questions #
What is an ROI localization anchor and why does it matter for packaging inspection?
A localization anchor (ROI — region of interest) is the specific sub-region of a packaging image that the inspection system uses as its spatial reference point before evaluating print quality, barcodes, or surface defects. If the system can’t reliably identify this anchor on every image pass, every downstream check becomes positionally unreliable — leading to both false rejects and missed defects. It’s the foundation of the entire inspection pipeline.
Why is a sub-100 ms extraction time significant for production lines?
At typical carton production speeds of several hundred units per minute, an anchor extraction time above 100 ms creates a processing bottleneck that either forces line speed reduction or requires buffer queuing. The sub-100 ms benchmark demonstrated in field evaluations on standard i5 hardware confirms that this performance level is achievable without specialized high-performance computing infrastructure.
Can these inspection systems handle packaging with foil stamping or embossing?
This is where most systems struggle. Metallic surfaces and embossed areas create localized reflectance variation that can push contrast ratios below the 0.15 minimum threshold in the anchor validation step. The correct response is for the system to reject that region as an anchor candidate and search elsewhere — not to force an anchor in a region that will produce inconsistent matching. Confirm this behavior explicitly during vendor evaluation.
What causes the roughly 0.22% failure rate in anchor extraction?
The failures observed in multi-product testing were consistently traced to anchor candidates located in regions with significant background texture variation or high positional variance at the same nominal image location between frames. These aren’t algorithm failures — they reflect cases where no genuinely stable anchor existed in the selected region. A system that refuses to extract a bad anchor is behaving correctly.
How does this technology apply to label and barcode inspection, not just folding cartons?
The same ROI localization logic applies directly to custom labels and stickers with variable data printing, sequential numbering, or barcodes. The system must anchor accurately to a reference region before it can verify that a barcode is correctly positioned, fully printed, and readable to GS1 General Specifications for barcodes and data carriers on packaging standards. For variable data label runs, localization precision is arguably more critical than for fixed-design cartons.
Published by ukugi.com Technical Team | Request a quote


