

TL;DR #
Varnish overprint layers systematically reduce the calculated k/s absorption-scatter ratio of base inks relative to uncoated measurements, and only a color-matching model built from varnish-coated gradient samples can produce acceptable ΔE accuracy — in this substrate category, Group C (coated k/s + 45°a:0° geometry) achieved a mean ΔE of 1.82 versus 7.95 for the worst-case di/8° approach. For buyers specifying spot-color work on lacquered specialty substrates, this means supplier color-matching claims based on bare-substrate measurements are structurally unreliable and should be rejected without supporting spectrophotometric evidence. Request varnish-overprinted gradient swatches and 45°a:0° spectral data before approving any spot-color proof.
Overview #
Most procurement engineers treat varnish overprint as a finishing detail — something that happens after color is locked in. That assumption is where the expensive reprints start. Industrial-scale research conducted at a gravure printing facility using two primary ink channels (red and yellow), 11 concentration gradient levels per channel, and 8 mixed-ratio test samples across three distinct measurement geometries demonstrates conclusively that a gloss varnish layer is not optically neutral: it fundamentally changes the absorption-scatter behavior of every ink beneath it.
The experimental framework used GretagMacbeth SpectroEye (45°a:0°) and X-Rite Ci64 (di/8° and de/8°) instruments in parallel, enabling a direct within-sample comparison that few published studies have attempted. Evaluation criteria covered both colorimetric accuracy (CIE 1976 LAB under D65/10°) and spectral root-mean-square error — giving a more complete picture than ΔE alone.
The subject substrate is tipping paper — the narrow wrapper material that bonds a cigarette filter to the rod — but the physics described here apply equally to any lacquered specialty label or custom labels and stickers where gloss varnish is overprinted above spot-color gravure or flexo ink layers. Understanding the optical mechanism is the prerequisite for specifying measurement conditions correctly, and getting measurement conditions wrong is the single most common root cause of failed spot-color approvals we see in supplier qualification audits.

How Varnish Overprint Alters Spot-Color Ink Behavior #
The physics are worth understanding at a practical level, even if you never run a Kubelka-Munk model yourself.
When light enters a semi-transparent varnish layer from air, it undergoes reflection and refraction at the air-varnish interface. At the varnish-ink interface below, the difference in refractive indices triggers multiple internal reflections. These reflections create wavelength-dependent interference — which is why varnish-coated samples look different at different viewing angles, and why color measurement geometry is not a minor calibration footnote but the central variable in this entire problem.
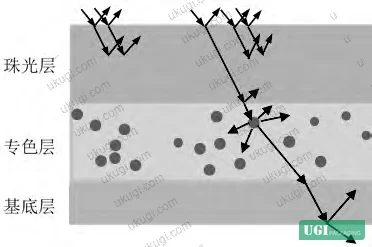
The key distinction from pearlescent overprint inks: pearl inks contain small semi-transparent mica flakes that act as multiple scattered micro-mirrors. A gloss varnish layer behaves as a single, continuous mirror surface. That structural difference is why measurement geometry recommendations developed for pearl ink applications do not transfer to varnish overprint applications — a point that trips up even experienced color specialists.
CIE recommends three reflection measurement geometries for packaging applications:
- 45°a:0° — annular illumination at 45°, detection at normal. Eliminates specular reflection entirely.
- de/8° — diffuse illumination, 8° detection, with the specular exclusion trap open. Excludes the 8° specular component but retains some off-angle specular content.
- di/8° — diffuse illumination, 8° detection, with the specular trap closed. Includes the full specular reflection contribution.
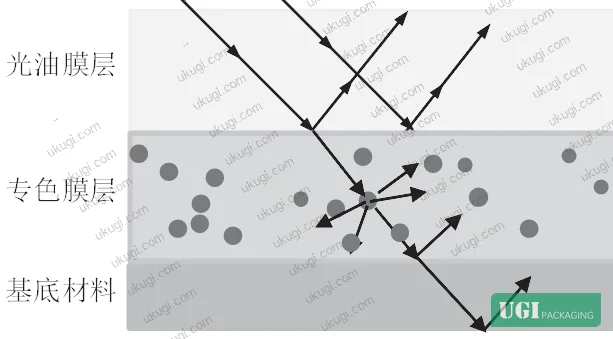
This matters because each geometry captures a different portion of the varnish surface reflection, and that captured reflection contaminates the k/s values you use to build your color-matching database. Build your database under di/8° and you are encoding specular noise as if it were ink absorption data. The downstream color formula errors are systematic, not random — they will be consistently wrong in the same direction.
Compliance with spectral measurement methodology is increasingly formalized. Practitioners evaluating color accuracy for print contracts increasingly reference ISO 12647-2:2013 Graphic technology — Process control for offset lithographic printing as a baseline for measurement condition documentation, even when the process in question is gravure rather than offset.
Measurement Geometry Impact on k/s Values and Spot-Color Matching Accuracy #
This is where the experimental data become directly procurement-relevant.
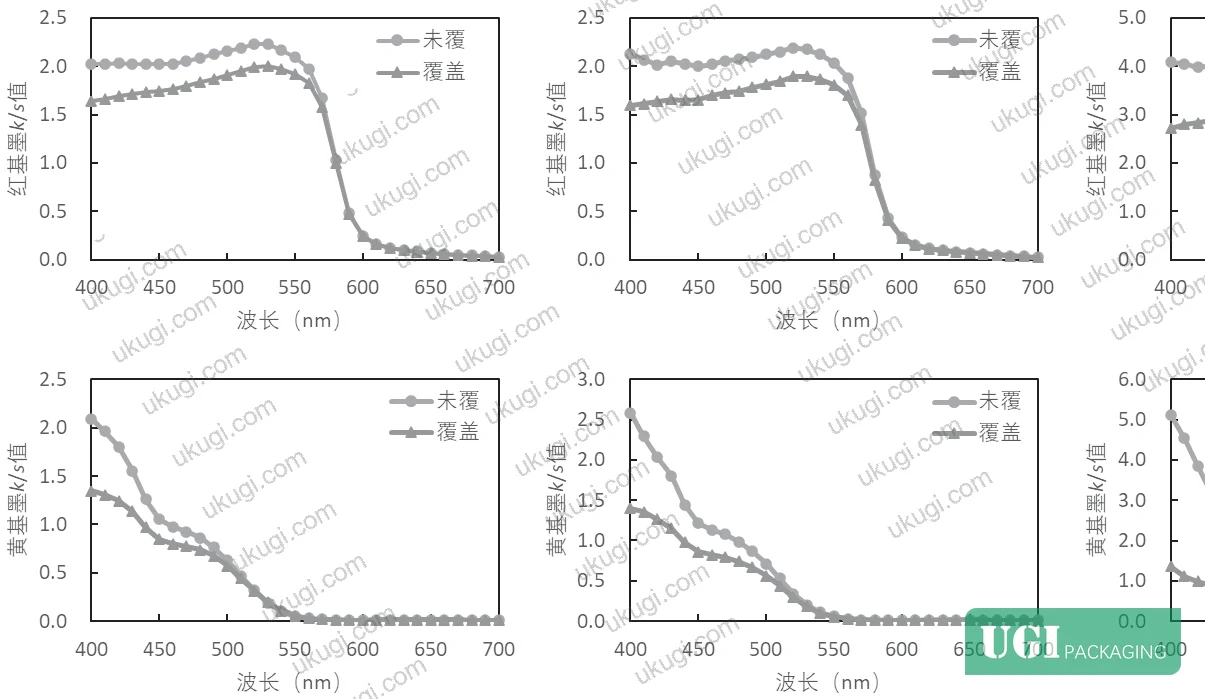
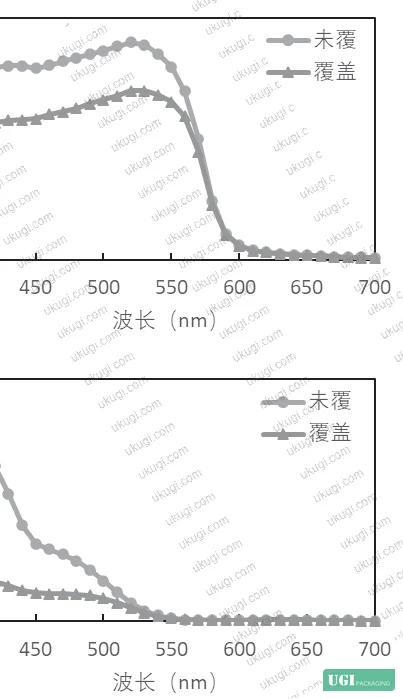
Across all three geometries, varnish-coated samples produced k/s values significantly lower than bare-substrate measurements. The varnish layer increases apparent scattering — which physically makes sense given the additional semi-transparent medium — but the magnitude of the shift means that any color-matching model built on uncoated k/s values will predict the wrong formula for a varnished output.
Comparing geometries directly:
- 45°a:0° and de/8° produce closely aligned k/s values for both red and yellow inks, under both coated and uncoated conditions.
- di/8° produces k/s values that diverge substantially from the other two geometries, particularly after varnish application, because it captures specular reflection that the other geometries exclude.
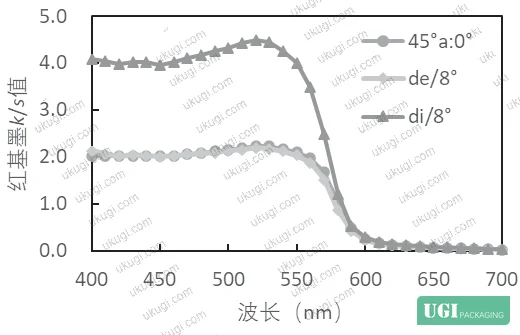
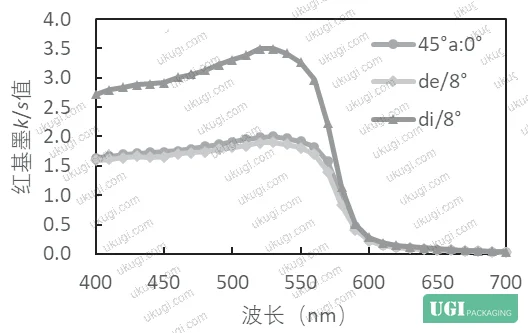
The three-group controlled experiment quantifies this precisely. Group A used bare-substrate k/s values to predict formulas for bare-substrate output. Group B used bare-substrate k/s values to predict formulas for varnish-overprinted output. Group C used varnish-coated k/s values to predict formulas for varnish-overprinted output. Results under D65/10° CIE 1976 LAB:
| Group | Measurement Geometry | Max ΔE | Mean ΔE | ΔE Variance | Max Spectral RMS | Mean Spectral RMS |
|---|---|---|---|---|---|---|
| A (bare k/s → bare output) | 45°a:0° | 8.22 | 4.14 | 1.86 | 0.1618 | 0.0868 |
| A | de/8° | 7.18 | 4.96 | 1.30 | 0.1428 | 0.1007 |
| A | di/8° | 10.21 | 7.95 | 1.19 | 0.2124 | 0.1676 |
| B (bare k/s → varnished output) | 45°a:0° | 5.09 | 2.29 | 1.33 | 0.1020 | 0.0489 |
| B | de/8° | 4.06 | 2.52 | 0.90 | 0.0840 | 0.0520 |
| B | di/8° | 7.13 | 5.87 | 0.79 | 0.1534 | 0.1247 |
| C (coated k/s → varnished output) | 45°a:0° | 4.07 | 1.82 | 1.02 | 0.0999 | 0.0538 |
| C | de/8° | 4.32 | 2.53 | 0.86 | 0.1032 | 0.0633 |
| C | di/8° | 11.69 | 5.86 | 3.18 | 0.2386 | 0.1124 |
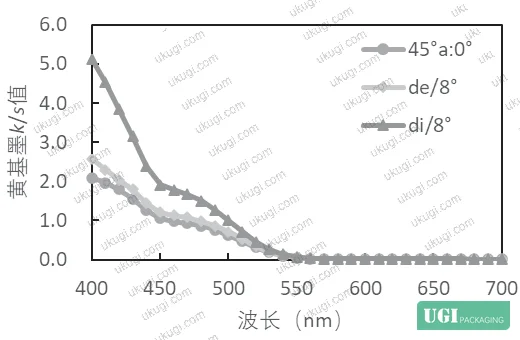
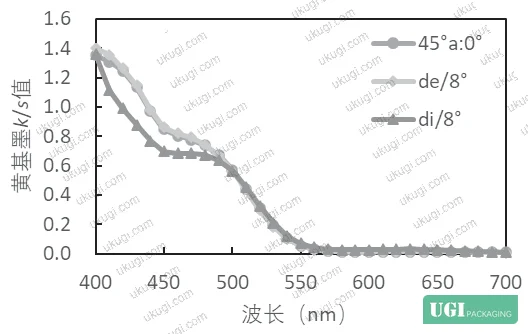
The headline finding: Group C with 45°a:0° geometry achieves the lowest mean ΔE at 1.82. Group A with di/8° geometry is the worst performer at a mean ΔE of 7.95 — more than four times the error of the best configuration.
Honestly, the variance column deserves more attention than it usually gets. A mean ΔE of 5.87 (Group B, di/8°) sounds tolerable until you look at the max ΔE of 7.13 — that’s a production batch with individual samples hitting visible color deviation. For regulated packaging categories, that is a rejection event, not a rework trigger.
The di/8° geometry’s failure under varnish conditions is a direct consequence of its inclusion of full specular reflection. When that specular data enters the Kubelka-Munk equations via the Saunderson correction (where the adjustment factor a=1 for di/8°, versus a=0 for de/8° and 45°a:0°), it distorts the calculated k/s values in a way that no downstream formula optimization can compensate for.
For quality teams specifying incoming inspection criteria, ISO 15397:2014 Printing inks — Determination of resistance to rubbing provides a parallel framework for documenting ink layer durability alongside color accuracy — relevant when varnish overprint is also serving a protective function on the substrate surface.
Kubelka-Munk Modeling and the Saunderson Correction in Practice #
You do not need to implement this model in-house. But understanding what it requires from your supplier is directly useful for supplier qualification.
The single-constant Kubelka-Munk framework establishes a relationship between spectral reflectance and the absorption-to-scatter coefficient ratio (k/s). For mixed spot inks, the k/s of the blend is a linear combination of the k/s values of each constituent base ink, weighted by mass proportion. Add varnish overprint and you introduce a surface boundary with a different refractive index — the Saunderson correction accounts for this by modeling the multiple internal reflections at the ink-varnish interface.
The standard parameter values used in the correction are γλ1 = 0.04 (surface reflection of collimated incident light) and γλ2 = 0.6 (internal reflection fraction). These are not arbitrary — they represent empirically validated estimates for typical ink film systems — but they assume a specific measurement geometry for their interpretation to be valid.
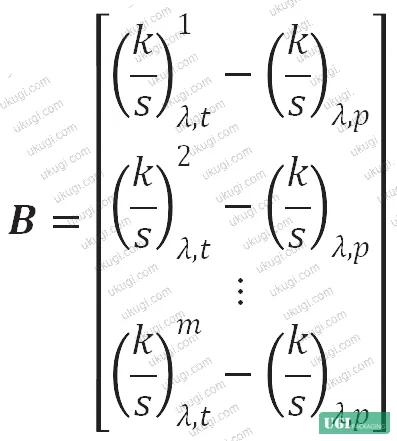
Building the base ink k/s database requires preparing concentration gradient samples — in this study, 11 gradient levels per ink channel, with mass ratios from 100:0 (pure diluent) through varying proportions to approximately 75% base ink concentration. Each gradient sample is measured spectrally, and a least-squares overdetermined system is solved to extract the k/s per wavelength per ink. The formula optimization then uses sequential quadratic programming to find the base ink mass ratios that minimize spectral reflectance error between predicted and target.
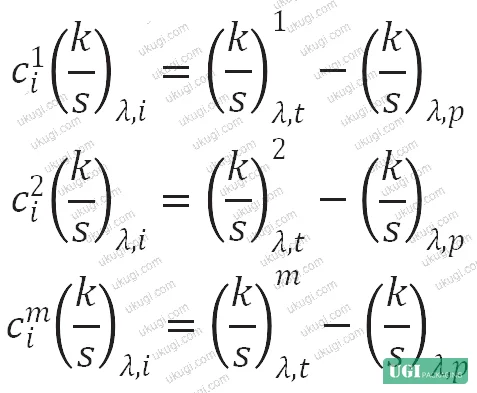
The critical process gate: if the gradient samples used to build the k/s database do not include the varnish overprint layer, the resulting k/s values are wrong for varnished output. This is Group B’s error in the experiment. It is also the most common error in production environments — suppliers often build their color-matching database once and apply it across substrates and finishing configurations without rebuilding for each surface condition.
For film-based substrates and flexible packaging formats, spectral measurement consistency under different surface treatments is similarly governed by ASTM D882 Standard Test Method for Tensile Properties of Thin Plastic Sheeting in the material characterization domain — underlining that surface finish variables propagate through multiple measurement parameters beyond color alone.
Practical Guidance for Buyers #
If you are sourcing specialty labels, lacquered folding cartons, or any printed substrate where gloss varnish overprints a spot color, the measurement geometry your supplier uses to maintain their color-matching database is not a technical footnote — it directly determines whether their formula predictions will hold on your production run.
Most procurement teams don’t realize that the instrument setting your supplier uses for color QC (di/8° is the default on most sphere-based spectrophotometers) is actually the worst-performing geometry for varnish-overprinted work. A supplier using di/8° for both database building and production QC on lacquered substrate will systematically underperform on mean ΔE — not because their equipment is wrong, but because they have not corrected for the specular inclusion that varnish introduces.
The practical checklist for a qualification audit is short: confirm that the supplier’s k/s database was built from varnish-coated gradient samples (not bare-substrate), confirm the measurement geometry is 45°a:0° or de/8° (not di/8°), and ask for the mean ΔE and max ΔE from their batch release data on varnished output. A mean ΔE below 2.0 under Group C conditions is achievable — anything above 3.0 suggests the database or measurement protocol needs review.
At ukugi.com, our production team in Guangzhou builds substrate-specific color-matching databases for each finishing configuration — including separate gradient references for varnish-overprinted, foil-stamped, and uncoated surfaces — so that spot-color approvals hold from first proof through production batch. We work with brand owners, packaging buyers, and product managers across North America, Europe, and Southeast Asia on exactly these kinds of finish-dependent color specifications.
Need a custom formulation or sample? Request a quote from our team →
Technical Verification Questions #
Key technical points to verify when evaluating any supplier in this category (including us):
- Were the base ink k/s absorption-scatter coefficient databases built from varnish-overprinted concentration gradient samples, or from bare-substrate measurements — and can you provide the spectral reflectance data from those gradient samples showing all 11 concentration levels?
- What measurement geometry does your spectrophotometer use when capturing the color-matching reference data for lacquered substrates — and can you confirm it is 45°a:0° or de/8°, not di/8°, for overprinted varnish applications?
- In your most recent batch release data for varnish-overprinted spot-color work, what was the mean ΔE under D65/10° CIE 1976 LAB — and was the maximum ΔE across the batch below 5.0?
- How do you apply the Saunderson correction for internal reflection when modeling varnish-overprinted ink layers — specifically, what value do you use for the internal reflection factor γλ2, and how do you set the geometry-dependent adjustment factor a?
- For mixed spot inks using red and yellow base channels, what concentration gradient increments do you prepare when building the k/s database, and how many gradient levels (minimum) are included per ink channel to ensure the least-squares solution is sufficiently overdetermined?
Quality Verification Checklist #
- ☐ Supplier confirms k/s database was built from varnish-overprinted gradient samples, not bare-substrate samples (Group C methodology)
- ☐ Measurement geometry for color-matching database is 45°a:0° or de/8° — di/8° is documented as excluded for lacquered overprint work
- ☐ Mean ΔE for varnish-overprinted spot-color batches is ≤2.0 under D65/10° CIE 1976 LAB
- ☐ Maximum ΔE across any production batch of varnished spot-color output is ≤5.0
- ☐ Base ink concentration gradient database includes ≥11 levels per ink channel
- ☐ Saunderson correction is applied with γλ1 = 0.04 and γλ2 = 0.6, with geometry-appropriate a value (a=0 for 45°a:0° and de/8°; a=1 for di/8°)
- ☐ Spectral RMS error (mean) for varnish-overprinted output is documented at ≤0.06 across the visible spectrum
- ☐ Supplier can provide separate k/s reference datasets for varnished versus unvarnished finishing configurations on the same substrate
Key Specifications Table #
| Parameter | Recommended Value | Verification Method |
|---|---|---|
| Measurement geometry for varnished spot color | 45°a:0° (preferred) or de/8° | Instrument specification sheet; confirm specular trap status in measurement report |
| Mean ΔE (D65/10°, CIE 1976 LAB) | ≤2.0 for varnish-coated output | Spectrophotometric comparison of predicted vs. produced samples under stated geometry |
| Maximum ΔE per batch | ≤5.0 | Batch release spectral data; flag any sample exceeding 5.0 for formula review |
| k/s database gradient levels per base ink | ≥11 concentration levels | Review gradient preparation log; confirm varnish overprint applied to all gradient samples |
| Saunderson internal reflection factor γλ2 | 0.6 (standard) | Color-matching software configuration documentation |
| Spectral RMS error (mean) | ≤0.06 | Spectral comparison report between target and predicted reflectance curves |
| Base ink diluent ratio for viscosity matching | 1:2 (ink:diluent by mass) | Production parameter log confirming viscosity matched to press conditions |
Looking for a manufacturer that meets these specs? Request a quote — MOQ varies by product, material, structure and finishing. Product-specific MOQ is confirmed with each quotation.
References #
Data source: Spot Color Matching Accuracy for Varnish-Overprinted Specialty Substrates: Effect of Measurement Geometry on Kubelka-Munk Modeling, W.-E. Zhu et al., Journal of Applied Polymer Science, 2025
Frequently Asked Questions #
Why does di/8° geometry perform so poorly for varnish-overprinted spot-color matching?
The di/8° geometry keeps the specular inclusion trap closed, meaning the measurement captures the full specular reflection from the varnish surface. When that specular component enters the Kubelka-Munk k/s calculation via the Saunderson correction (where the geometry factor a=1), it artificially inflates the apparent scattering contribution of the ink layer. The resulting k/s values are physically inaccurate for the actual ink, and any formula optimization built on them will produce systematic color errors. In the controlled experiment, di/8° produced a mean ΔE of 7.95 in the worst-case scenario — more than four times the error of the best configuration.
Can I use the same color-matching database for both varnished and unvarnished versions of the same job?
No. The experimental data are unambiguous on this point: using bare-substrate k/s values to predict formulas for varnished output (Group B) produces mean ΔE values of 2.29 to 5.87 depending on geometry, versus 1.82 to 2.53 when the database is built from coated samples (Group C). If your product ships with a varnish overprint, the k/s database must be built from varnish-coated gradient swatches on the same substrate. Maintaining two separate databases — one coated, one bare — is the only reliable approach when both finished forms exist in your product range.
What substrate types does this measurement geometry guidance apply to beyond tipping paper?
The optical mechanism — varnish acting as a continuous specular layer above the ink — is not substrate-specific. It applies to any lacquered label, gloss-varnished folding carton, or overprinted flexible pouch where a spot color is printed beneath a clear coat. For custom paper boxes and cosmetics packaging solutions with gloss spot UV or full varnish flood coats, the same 45°a:0° measurement geometry recommendation and the requirement for coated gradient databases apply.
How many concentration gradient samples are needed to build a reliable k/s database?
The research used 11 gradient levels per base ink channel, with mass ratios spanning from approximately 10% base ink (90% diluent) up to 75% base ink (25% diluent). This creates an overdetermined least-squares system — more equations than unknowns — which produces a more stable k/s solution than a minimal set would. Fewer than 8 gradient levels per channel introduces meaningful estimation error in the k/s values, particularly at the extremes of the concentration range where the relationship between reflectance and absorption becomes nonlinear.
Is 45°a:0° always better than de/8° for this application?
Marginally, based on the mean ΔE data: Group C at 45°a:0° returned 1.82 versus 2.53 for de/8°. The difference is real but not large enough to be a hard rejection criterion if a supplier only has sphere-based equipment. What matters more is that both 45°a:0° and de/8° substantially outperform di/8° — mean ΔE of 1.82 and 2.53 versus 5.86 — and that whichever geometry is used for the production database must also be used for all subsequent production QC measurements. Consistency between database geometry and QC geometry is more important than which of the two acceptable geometries you choose.
Published by ukugi.com Technical Team | Request a quote


