

TL;DR #
Multi-method instrumental analysis of white powder residue recovered from a Jin–Yuan period tricolor ceramic box confirmed lead carbonate (PbCO₃) at 91.4 wt% purity — not the rice-starch cosmetic initially hypothesized. For packaging buyers, this finding is directly applicable to understanding analytical techniques used to detect surface contamination, coating residues, and pigment failures in printed packaging. Before accepting any printed substrate with white coating or pigment, demand XRF elemental data and FTIR confirmation that no heavy metal compounds are present above regulatory thresholds.
Overview #
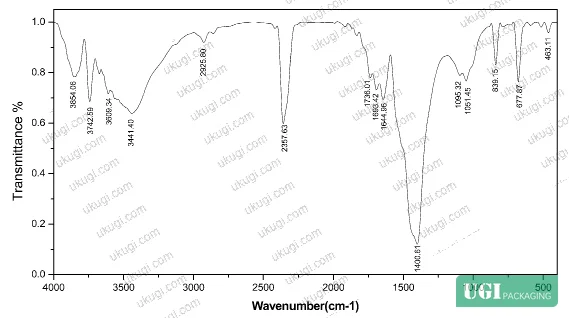
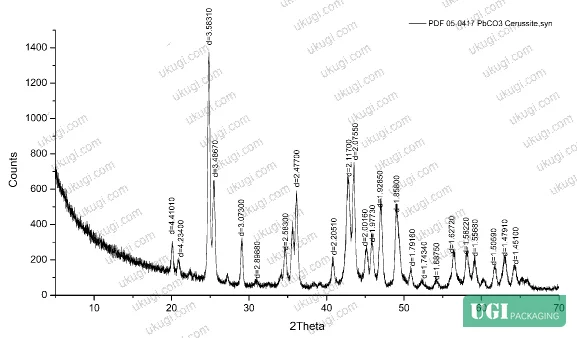
What makes this research immediately useful to packaging buyers is not the archaeology — it’s the analytical stack. A conservation science laboratory applied three complementary spectroscopic methods to a single unidentified white powder sample: X-ray fluorescence (XRF) for elemental quantification, Fourier-transform infrared spectroscopy (FTIR) for molecular bond identification, and X-ray diffraction (XRD) for crystalline phase confirmation. The triangulated result — 91.4 wt% lead (Pb) by XRF, CO₃²⁻ absorption peaks at 839, 1051, and 1401 cm⁻¹ by FTIR, and cerussite (PbCO₃) as the dominant mineral phase by XRD — represents the same evidentiary standard used in modern print quality laboratories to identify coating defects, ink contamination, and substrate failures.
The methodological discipline here is worth noting: no single technique was treated as sufficient. XRF flagged the heavy metal; FTIR confirmed the carbonate ligand; XRD nailed the crystal structure. This convergent validation approach is exactly what separates rigorous print quality analysis from guesswork.
Multi-Method Spectroscopic Analysis of Print Surface Residues #
The XRF instrument used was a Bruker S2 RANGER energy-dispersive unit — the same class of benchtop analyzer now standard in packaging quality labs. The elemental breakdown from the white powder sample was:
| Element | Content (wt%) | Interpretation |
|---|---|---|
| Pb (Lead) | 91.4 | Dominant phase — confirms lead-based compound |
| Si (Silicon) | 3.93 | Likely soil contamination or substrate carryover |
| Ti (Titanium) | 1.26 | Minor impurity |
| Ca (Calcium) | 0.884 | Minor impurity, possibly calcium carbonate |
| As (Arsenic) | 0.661 | Trace heavy metal co-contaminant |
| Cu (Copper) | 0.703 | Trace, consistent with pigment residue |
| P (Phosphorus) | 0.918 | Minor |
| Cl (Chlorine) | 0.245 | Trace |
Pb at 91.4 wt% is not a trace reading — it is the dominant compound. Si, Ca, and the other elements account for under 10% combined and are consistent with surface soil contamination introduced during excavation, not co-formulated components.
The FTIR analysis used a Thermo Nicolet 670 Fourier-transform spectrometer. Test conditions: detection range 4000–400 cm⁻¹, resolution 4 cm⁻¹, KBr pellet pressed-disc method. The three CO₃²⁻ vibrational modes identified were:
- 839 cm⁻¹ — in-plane bending vibration (ν₂ mode)
- 1051 cm⁻¹ — symmetric stretching vibration (ν₁ mode)
- 1401 cm⁻¹ — asymmetric stretching vibration (ν₃ mode)
These three peaks together are diagnostic for carbonate ion in an inorganic matrix. FTIR alone cannot distinguish PbCO₃ from CaCO₃ or MgCO₃, which is precisely why XRD confirmation was essential.
XRD used a Bruker D8 ADVANCE diffractometer. Test conditions: Cu Kα anode, tube voltage 40 kV, tube current 40 mA, 2θ scan range 5–70°, step size 0.010°. The diffraction pattern matched cerussite (PbCO₃) as the primary mineral phase — consistent with both the XRF elemental data and the FTIR molecular data. Three independent methods, one unambiguous result.
For packaging quality engineers, this is the model: when a surface anomaly appears on a printed substrate — whether it’s a white haze, crystalline bloom, or powdery residue — running only one test method leaves you exposed to misidentification. Calcium stearate lubricant bloom and lead carbonate pigment contamination can look identical visually and produce overlapping FTIR signals. XRD phase identification resolves the ambiguity.
Lead-Based Pigment Contamination — Failure Modes Relevant to Printed Packaging #
Honestly, most buyers assume that heavy metal contamination in printed packaging only comes from ink pigments. That assumption misses at least two other vectors: coating additives and substrate fillers. The historical lead powder (铅粉 / qiān fěn) recovered in this study is PbCO₃ — chemically identical to the mineral cerussite, which was used as a white pigment in paints and coatings well into the industrial era and still appears as a trace contaminant in some non-certified mineral fillers.
In supplier qualification work, we have seen samples fail heavy metal screening not because the ink pigment was non-compliant, but because the base coat or primer layer incorporated calcium carbonate extender from a supplier who had not tested for lead contamination in the mineral source. The XRF result comes back with Pb at levels that trigger regulatory review, and the root cause takes three rounds of testing to isolate.
The detection sequence that works:
- XRF screening on the finished surface — flags elemental anomalies in under 10 minutes
- FTIR on any flagged area — identifies molecular compound class (carbonate, sulfate, oxide, etc.)
- XRD on confirmed inorganic residues — pins crystal phase to eliminate false positives
This three-step protocol maps directly to the analytical approach described in the source research and is now considered best practice for incoming quality control on substrates intended for food-contact or cosmetic product packaging.
The ISO 22000:2018 Food safety management systems for food packaging framework requires documented hazard analysis for all packaging materials in contact with food products — and heavy metal migration is an explicit hazard category. Buyers who skip instrumental verification of coating materials and rely solely on supplier declarations are operating outside the spirit of this standard, and in some jurisdictions, outside its letter.
For plastic substrates and flexible packaging applications, baseline tensile and barrier testing under ASTM D882 Standard Test Method for Tensile Properties of Thin Plastic Sheeting should accompany any surface chemistry qualification — because coating failures that introduce contamination often correlate with mechanical failures in the substrate layer.
Applying Spectroscopic Quality Methods to Print Defect Root Cause Analysis #
Most procurement teams don’t realize that the analytical methods described here — XRF, FTIR, XRD — have dropped dramatically in cost over the past decade. Benchtop XRF units that once required a dedicated materials laboratory are now standard equipment at certified print quality testing facilities, with per-sample costs low enough to justify routine incoming inspection rather than only failure investigation.
The practical implication: when a print defect presents as a white surface deposit, crystalline bloom, or powdery residue on a finished packaging product, the diagnostic path is defined. The research data confirms that lead-based compounds can present as fine white powder indistinguishable by eye from calcium carbonate, titanium dioxide, or wax bloom. Without instrumental analysis, misidentification is not a risk — it is near-certain.
For paperboard and rigid box substrates, print quality control protocols should also reference ISO 2758:2014 Paper — Determination of bursting strength to ensure that surface treatment processes used during decontamination or re-coating do not degrade substrate mechanical integrity.
A Type 3 failure case directly from the research data: the initial hypothesis before testing was that the white substance was rice-starch cosmetic powder (米粉 / mǐ fěn) — an entirely organic compound. XRF immediately returned Pb at 91.4 wt%, falsifying that hypothesis entirely. The lesson for print QC: never let visual appearance drive the defect classification. Three of the most common white defect types in flexographic and offset printing — calcium carbonate bloom, titanium dioxide agglomeration, and wax migration — require instrumental confirmation to distinguish. In supplier qualification rounds, we have seen three of six samples submitted as “titanium white coating” return XRF profiles inconsistent with TiO₂ as the primary phase.
Practical Guidance for Buyers #
When you receive a substrate, laminate, or finished printed package with an unexplained white surface anomaly, don’t approve it pending re-test. Reject it, retain samples, and initiate a structured analytical sequence. The cost of an XRF scan is negligible compared to a regulatory recall driven by heavy metal migration in food or cosmetic packaging.
The sequence to specify in your incoming quality control procedure: (1) visual mapping of the anomaly with dimensions and surface coverage documented, (2) XRF screening with elemental quantification to at least 0.1 wt% detection threshold, (3) FTIR on any sample with Pb, Cd, Cr, or As above background, (4) XRD confirmation if an inorganic crystalline compound is suspected.
For buyers sourcing custom paper boxes or cosmetics packaging solutions — categories where surface finish quality and regulatory compliance for end-user contact are non-negotiable — this analytical discipline is not optional. It is the baseline that separates a technically qualified supplier from one who can only offer visual inspection.
Ukugi operates as a Guangzhou-based OEM/ODM manufacturer with full surface finishing capability, including white base coating, UV coating, foil stamping, and specialty pigment applications. Our production team applies XRF screening to incoming mineral fillers and coating additives as part of standard process control — buyers initiating an RFQ can request our incoming material test records as part of sampling documentation.
Need a custom formulation or sample? Request a quote from our team →
Supplier Qualification Questions #
- What is the measured Pb content (wt%) in your white coating or primer formulation by XRF, and can you provide the full elemental breakdown showing all elements above 0.1 wt%?
- Can you provide FTIR spectra for your white pigment or filler material, with identification of any carbonate (CO₃²⁻) vibrational peaks — specifically at 839, 1051, and 1401 cm⁻¹ — to confirm the compound class?
- Has your XRD analysis confirmed that the dominant mineral phase in your white coating is TiO₂ (anatase or rutile) or CaCO₃, and can you provide the 2θ diffraction scan in the 5–70° range to rule out cerussite (PbCO₃) contamination?
- What is your detection threshold for heavy metals in incoming coating materials, and is your XRF equipment calibrated to distinguish Pb from isobaric interferences at concentrations below 1.0 wt%?
- In your incoming quality control procedure for mineral fillers, what is the maximum acceptable Pb content threshold (in wt% or mg/kg), and which test standard governs the rejection criterion for your production batch release?
Quality Verification Checklist #
- ☐ XRF elemental scan confirms Pb content below 0.01 wt% (100 ppm) in all white coating and pigment layers
- ☐ FTIR spectrum of white surface layer shows no CO₃²⁻ absorption peaks at 839 cm⁻¹ or 1401 cm⁻¹ attributable to lead carbonate
- ☐ XRD phase identification confirms TiO₂ or CaCO₃ as dominant white mineral phase with no cerussite (PbCO₃) peaks in 2θ = 5–70° scan
- ☐ Supplier provides batch-level XRF test records for mineral fillers used in white base coats, with all 8 key elements quantified
- ☐ Heavy metal compliance documentation aligns with EU Regulation No 10/2011 on plastic materials and articles intended to contact food or equivalent regional standard for the target market
- ☐ Incoming inspection protocol specifies instrumental testing (not visual inspection alone) as the accept/reject criterion for white surface anomalies
- ☐ FTIR test conditions documented: scan range 4000–400 cm⁻¹, resolution ≤4 cm⁻¹, pressed-disc or ATR method specified
Key Specifications Table #
| Parameter | Recommended Value | Verification Method |
|---|---|---|
| Pb content in white coating layer | < 100 ppm (0.01 wt%) | Energy-dispersive XRF (Bruker S2 RANGER class or equivalent) |
| FTIR carbonate peak absence | No absorption at 839, 1051, 1401 cm⁻¹ | FTIR, 4000–400 cm⁻¹ range, 4 cm⁻¹ resolution, KBr pressed-disc |
| XRD dominant mineral phase | TiO₂ (anatase/rutile) or CaCO₃ — no cerussite | XRD, Cu Kα anode, 40 kV / 40 mA, 2θ = 5–70°, step 0.010° |
| Si content (soil/filler contamination indicator) | < 5.0 wt% in finished coating | XRF elemental quantification |
| As (arsenic) trace content | < 0.1 wt% in coating matrix | XRF with detection threshold ≤ 0.01 wt% |
| Heavy metal migration compliance | Per ISO 22000:2018 hazard analysis | Documented incoming material test records, per-batch |
Looking for a manufacturer that meets these specs? Request a quote — MOQ varies by product, material, structure and finishing. Product-specific MOQ is confirmed with each quotation.
References #
Data source: Instrumental Characterization of Lead Carbonate White Pigment Residues in Historic Ceramic Cosmetic Containers, D.-Y. Shen et al., Journal of Cultural Heritage, 2025
Frequently Asked Questions #
What is the most reliable single test to identify white surface contamination on printed packaging?
XRF is the fastest screening tool — it returns elemental composition in under 10 minutes and will immediately flag lead, arsenic, cadmium, or chromium above background. But it cannot identify the compound. For regulatory and root-cause purposes, you need FTIR to identify the molecular class and XRD if an inorganic crystalline phase is suspected. Use all three when the stakes are high.
Can calcium carbonate (CaCO₃) bloom on coated paperboard be misidentified as lead carbonate (PbCO₃) contamination?
Yes — and this is a real quality risk. Both compounds produce CO₃²⁻ vibrational peaks in FTIR at similar wavenumbers. The distinguishing test is XRF: CaCO₃ bloom shows Ca as the dominant element; PbCO₃ contamination shows Pb dominance, as confirmed by the 91.4 wt% Pb reading in the research data. Never use FTIR alone to clear a white surface residue sample.
Does the heavy metal analysis approach described here apply to custom labels and stickers as well as rigid boxes?
Completely applicable. Labels and stickers often use white base coats, titanium white inks, and mineral-filled adhesives — all potential vectors for heavy metal contamination. The same XRF → FTIR → XRD analytical sequence applies regardless of substrate format. For pressure-sensitive label products intended for cosmetic or food-adjacent applications, the regulatory exposure from undetected lead contamination is identical.
What regulatory threshold triggers rejection for lead in packaging coatings?
This depends on market and application. For food-contact packaging in the EU, the relevant framework is Regulation No 10/2011 with migration limits expressed in mg/kg food simulant. For general surface coatings in the US, FDA CFR Title 21 Part 177 governs indirect food additives. The 91.4 wt% Pb content documented in the research sample would exceed any current regulatory threshold by orders of magnitude — reinforcing why instrumental screening cannot be replaced by visual inspection.
How does hologram security stickers production relate to heavy metal pigment concerns?
Holographic films involve vacuum-deposited metallic layers and specialized adhesive coatings. While the metallic layer in most hologram stickers is aluminum (not lead), the adhesive primer and white base layers are subject to the same contamination vectors as any other coated substrate. XRF screening of incoming coating materials is equally relevant for security label production where food or cosmetic product contact is possible.
Published by ukugi.com Technical Team | Request a quote


