

TL;DR #
Differential Raman spectroscopy combined with K-means clustering and Fisher discriminant analysis achieves 100% classification accuracy across five filler-defined categories of white paper shopping bags, with an RBF neural network model reaching 89.48% accuracy on unknown samples. For procurement and quality teams, this means non-destructive material verification of paper bag substrates is now technically viable at production-batch scale — without destroying samples. If you are sourcing custom paper bags and need to verify substrate consistency across production runs, demand spectral characterization data from your supplier alongside standard mechanical test reports.
Overview #
White paper shopping bags sit at the intersection of sustainability marketing and substrate complexity that most buyers underestimate. The interior is almost always white, the caliper looks consistent, and the print surface feels comparable — but the filler chemistry can vary significantly between manufacturers, and that variation directly affects print adhesion, surface brightness, ink absorption, and even flame retardancy. A controlled study conducted by forensic materials specialists at a national public security research institution examined 60 white paper shopping bags drawn from a wide range of commercial brands and size specifications. Each sample was analyzed using differential Raman spectroscopy under standardized conditions (250 mW laser power, 3-second integration time, scan range 250–2,800 cm⁻¹), then processed through a chemometric pipeline combining PCA dimensionality reduction, K-means clustering, Fisher discriminant analysis, and RBF neural network modeling. The KMO test result of 0.996 confirmed strong inter-variable correlation, validating the PCA approach. What the data reveals about substrate material classification has direct implications for print quality control, supplier qualification, and incoming goods inspection — whether you are buying commodity paper bags or commissioning custom paper boxes with specific surface finish requirements.
Filler Composition as the Root Cause of White Paper Bag Print Variability #
The central finding that most procurement teams miss: whiteness and caliper tell you almost nothing about how a paper bag will behave on-press. What actually determines ink adhesion, surface pH compatibility, and gloss response is the filler package — and across 60 commercial samples, five distinct filler profiles were identified.
The classification breaks down as follows:
| Category | Filler Composition | Sample Count | Key Print Implication |
|---|---|---|---|
| Ⅰ | Calcium carbonate + talc | 7 samples | High opacity, moderate gloss, good ink absorption |
| Ⅱ | Barium sulfate only | 6 samples | High brightness, low absorption, slower ink dry |
| Ⅲ | CaCO₃ + BaSO₄ + talc | 15 samples | Broadest performance envelope, highest print fidelity risk |
| Ⅳ | Talc only | 16 samples | Improved smoothness and printability, neutral pH |
| Ⅴ | None of the above (no CaCO₃, BaSO₄, or talc) | 16 samples | Unmodified base pulp — least predictable surface behavior |
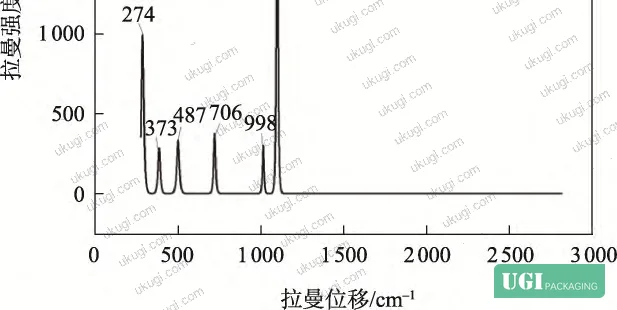
Each filler has a distinct function. Talc increases surface smoothness, gloss, and whiteness while keeping the substrate relatively neutral. Calcium carbonate is cheap, raises opacity, improves ink holdout, and acts as a flame retardant — but it creates an alkaline surface environment that can cause issues with acid-cure inks. Barium sulfate pushes brightness and smoothness further, improving printability metrics, but at the cost of slower ink penetration. The Raman characteristic peaks that separate these fillers are unambiguous: calcium carbonate peaks at 280, 711, and 1,085 cm⁻¹; barium sulfate at 996, 1,115, and 1,148 cm⁻¹; talc at 370, 430, and 502 cm⁻¹. Cellulose — present in essentially all samples — is not useful as a discriminator precisely because it appears everywhere.
Honestly, most buyers over-specify surface brightness (ISO whiteness ≥ 95%) while completely ignoring filler composition in their incoming goods specs. That is a mistake. Two bags with identical whiteness values can have entirely different ink absorption curves depending on whether the filler is talc, CaCO₃, or BaSO₄ — and that difference shows up as ink trap failure or mottling in multicolor print runs.

For print quality standards reference, ISO 12647-2:2013 Graphic technology — Process control for offset lithographic printing defines tone value increase and ink density tolerances that are directly sensitive to the substrate’s ink absorption behavior — which filler composition governs.

Chemometric Classification Pipeline: Accuracy Data and Practical Limits #
The classification methodology used here is worth understanding in detail because it maps directly onto how you should structure a supplier audit or incoming batch verification protocol.
Stage 1 — PCA dimensionality reduction: The raw Raman spectral dataset carries 2,048 variables per sample. PCA reduced this to 16 principal components with a cumulative variance contribution rate of 99.076%. The first principal component alone accounted for 74.411% of variance; the second added 10.587%, bringing the cumulative total to 84.998% after just two components. This means the bulk of discriminating information between filler types concentrates in a very compact feature space — which makes automated classification at production scale genuinely feasible.
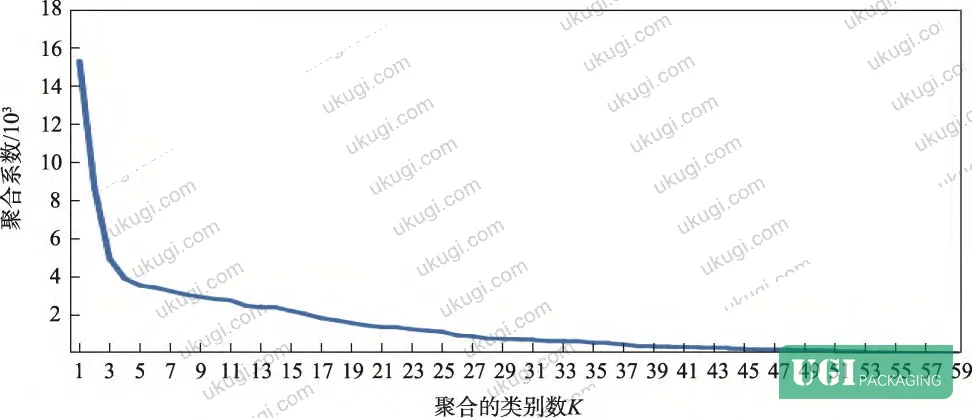
Stage 2 — K-means clustering (K=5): Using the elbow method on the within-cluster sum of squares, the optimal K value was confirmed at 5. The clustering produced results largely consistent with the filler-based classification, with five samples showing discrepancies attributable to variance inhomogeneity in the spectral data and sensitivity to initial cluster center selection.
Stage 3 — Fisher discriminant analysis for validation: Three discriminant functions were constructed from the 16 PCA-reduced variables. Function 1 carried 78.5% of discriminating variance; Function 2 carried 20.1%; combined cumulative contribution reached 98.6%. All three Wilks’ Lambda values showed significance levels below 0.05 (lambda values: 0.008, 0.016, and 0.046 respectively), confirming statistical validity. Cross-validated classification accuracy: 100% across all five groups.
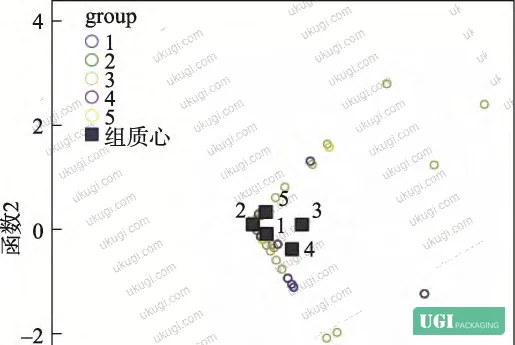
Stage 4 — RBF neural network for unknown sample prediction: The model was trained on 42 samples (70%) and tested on 18 samples (30%). Training set accuracy: 94.66%. Test set accuracy: 84.3%. Overall model accuracy: 89.48%.
Here is where the friction lives. In the RBF test set, Category 1 samples showed a 73.3% correct classification rate — the weakest performance in the model. Misclassification concentrated in samples whose Raman spectra fell near cluster boundaries, particularly where the CaCO₃ and talc peak intensities were low relative to background cellulose signal. In practical terms: samples at the boundary of the filler-only and mixed-filler categories are the hardest to classify, and those are also the samples most likely to show inconsistent print behavior. That boundary ambiguity is exactly the quality risk you need to screen for during supplier qualification.


Substrate Uniformity Testing: What the Within-Sample Data Shows #
Before any classification analysis, the study established instrument repeatability and sample homogeneity through two dedicated experiments that are directly relevant to how buyers should specify acceptance criteria.
Repeatability test: A single sample (sample 27) was measured 10 times at the same location under identical conditions. The resulting spectra were essentially superimposable — confirming that instrument drift and measurement noise were not contributing to classification variance. This is important because it means any batch-to-batch spectral differences you detect are real material differences, not measurement artifacts.
Uniformity test: Sample 15 was tested at five different positions (top, bottom, left, right, center). The spectra across all five positions were consistent, confirming that filler distribution within a single bag is homogeneous. This is the result buyers should hope for — but it also means that a bag which shows spectral inconsistency across positions has a real manufacturing quality problem, not a test artifact.
For buyers evaluating paper bags against physical performance standards, ISO 2758:2014 Paper — Determination of bursting strength provides the framework for correlating filler content with mechanical performance, since high barium sulfate loading can reduce tensile strength even while improving print surface quality.
Most procurement teams don’t realize that paper bag substrate specifications in supplier contracts almost never reference filler type or loading percentage — they reference brightness, caliper, and basis weight. The filler package is treated as a manufacturing trade secret. But emerging application of spectral analysis methods in quality control is starting to change that, with buyers in pharmaceutical and premium packaging sectors beginning to require material fingerprinting data as part of supplier qualification. This shift is overdue in commercial retail packaging as well.


Practical Guidance for Buyers #
If you are sourcing white paper bags for retail, cosmetics, or premium gift applications, the filler composition question belongs in your technical specification document — not just the visual inspection checklist. Here is what to do with this information in practice.
First, establish a reference spectral fingerprint for approved production samples and require your supplier to maintain batch consistency against that fingerprint. You do not need a laboratory-grade Raman system to do this — portable differential Raman instruments have dropped in cost significantly and are now practical for incoming goods inspection.
Second, distinguish between filler categories when writing print specifications. A talc-only substrate (Category IV) will behave differently under UV flexo than a mixed CaCO₃ + BaSO₄ substrate (Category III). Your color targets and ink viscosity settings should account for this, not just your press calibration.
Third, the 89.48% overall accuracy of the RBF model for unknown samples means the technology works but is not perfect at substrate boundaries. In supplier qualification, combine spectral analysis with physical test data — bursting strength per TAPPI T 403 Bursting Strength of Paperboard, ink rub resistance, and surface pH — to build a complete material profile.
At ukugi.com, our team produces custom paper bags and premium packaging for international brand owners, and we can provide substrate composition data and print qualification samples before you commit to a production run. Whether you are specifying a straightforward retail carrier or a multi-finish gift packaging solution, the right substrate choice starts with the right material conversation.
Need a custom formulation or sample? Request a quote from our team →
Technical Verification Questions #
- Can you provide differential Raman spectral data for your production paper bag substrate, identifying which filler package (CaCO₃, BaSO₄, talc, or combination) is present and at what approximate loading, using the characteristic peaks at 280/711/1,085 cm⁻¹ for CaCO₃ and 370/430/502 cm⁻¹ for talc?
- What is the within-batch spectral uniformity across at least five measurement positions (top, bottom, left, right, center) on a standard production bag, and can you confirm the spectra are essentially superimposable with no significant peak shift or intensity variation?
- For substrates containing barium sulfate as a filler, what is the measured surface ink absorption rate compared to a talc-only substrate from the same basis weight, and how does this affect your recommended ink viscosity range for flexographic or offset printing?
- What is the PCA-derived variance contribution of the first two principal components when batch spectral data is analyzed — and is the cumulative variance of those two components above 85%, consistent with a well-controlled production substrate?
- For your production batches, what is the Fisher discriminant cross-validation accuracy when classifying substrate samples against your approved reference spectra — and can you demonstrate that all production samples fall within the 100% correct classification zone rather than in boundary-region ambiguity?
Quality Verification Checklist #
- ☐ Raman spectral analysis confirms filler type matches purchase specification — CaCO₃ peaks at 280, 711, 1,085 cm⁻¹ absent or present as specified
- ☐ Within-sample spectral uniformity confirmed across 5 measurement positions with no significant peak shift (reference: 10× repeatability test showing superimposable spectra)
- ☐ PCA of batch spectral data achieves cumulative variance contribution ≥ 99% within ≤ 16 principal components, confirming substrate consistency
- ☐ Fisher discriminant cross-validation accuracy ≥ 100% across all declared filler categories for the production reference set
- ☐ RBF or equivalent neural network model classification accuracy for test set samples ≥ 84.3% (matching the published test-set benchmark)
- ☐ Bursting strength verified per ISO 2758:2014 and consistent with declared basis weight and filler loading
- ☐ Surface pH confirmed compatible with specified ink chemistry (alkaline for CaCO₃-filled substrates; check with acid-cure ink systems)
- ☐ Substrate filler category documented in supplier’s batch release certificate and traceable to spectral reference data on file
Key Specifications Table #
| Parameter | Recommended Value | Verification Method |
|---|---|---|
| PCA cumulative variance (16 components) | ≥ 99.076% | PCA of 2,048-variable Raman spectral dataset; KMO test result ≥ 0.99 |
| Fisher discriminant classification accuracy (known samples) | 100% | Cross-validated Fisher LDA against 5-group K-means classification; Wilks’ Lambda p < 0.05 for all 3 functions |
| RBF neural network overall accuracy (unknown samples) | ≥ 89.48% (training: 94.66%, test: 84.3%) | 70/30 train-test split on 60-sample spectral dataset; normalized RBF activation function |
| Raman scan range | 250–2,800 cm⁻¹ | Differential Raman spectrometer; 250 mW laser power, 3 s integration time |
| CaCO₃ characteristic peaks | 280, 711, 1,085 cm⁻¹ | Differential Raman spectroscopy; peak presence/absence compared against reference |
| Talc characteristic peaks | 370, 430, 502 cm⁻¹ | Differential Raman spectroscopy; peak presence/absence compared against reference |
| BaSO₄ characteristic peaks | 996, 1,115, 1,148 cm⁻¹ | Differential Raman spectroscopy; peak presence/absence compared against reference |
| Within-sample spectral uniformity | Superimposable spectra across 5 positions | 5-point spatial test (top/bottom/left/right/center) on single production sample |
Looking for a manufacturer that meets these specs? Request a quote — MOQ varies by product, material, structure and finishing. Product-specific MOQ is confirmed with each quotation.
References #
Data source: Non-Destructive Classification of White Paper Shopping Bags Using Differential Raman Spectroscopy and Multivariate Chemometric Analysis, L. Luo et al., Journal of Applied Polymer Science, 2025
Frequently Asked Questions #
What is differential Raman spectroscopy and why is it relevant to paper bag quality control?
Differential Raman spectroscopy identifies molecular composition by measuring how laser light scatters off a material’s chemical bonds. For paper bags, this means you can identify which filler minerals are present — talc, calcium carbonate, barium sulfate — without cutting, dissolving, or otherwise destroying the sample. That non-destructive characteristic makes it practical for incoming goods verification on finished packaging.
Can two white paper bags with the same brightness rating have different print performance?
Yes, and this is one of the most common and costly assumptions in paper bag procurement. Two bags measuring identical ISO whiteness can fall into completely different filler categories — for example, one talc-only substrate and one barium sulfate substrate — and those substrates will absorb ink at different rates, respond differently to UV coating adhesion, and produce different gloss levels under the same press conditions. Brightness tells you about optical properties; filler composition tells you about print behavior.
How accurate is the RBF neural network model for classifying an unknown paper bag sample it has never seen before?
Based on controlled testing with an 18-sample holdout set, the RBF model achieved 84.3% test-set accuracy and 89.48% overall accuracy (combining training and test results). The weakest classification performance was in Category 1 samples (CaCO₃ + talc), where the model achieved 73.3% accuracy on the test set — meaning that mixed-filler substrates near category boundaries are the hardest cases. For production-scale use, this model performance is sufficient for screening but should be combined with physical test data for final acceptance decisions.
Does the filler type affect a paper bag’s structural performance, or only its print surface?
Both. Calcium carbonate improves opacity and ink holdout but also contributes flame retardancy. Talc improves smoothness and reduces friction coefficient, which matters for bag handling in automated retail environments. Barium sulfate adds density and brightness but can reduce tensile elongation at high loading levels. So the filler choice made during paper manufacturing has downstream effects on bursting strength, surface coefficient of friction, and ink adhesion simultaneously.
What sample preparation is required before Raman analysis of a paper bag?
Minimal. In the evaluation protocol, samples were cut to 0.5 cm × 0.5 cm, wiped lightly with anhydrous ethanol on a cotton swab, and allowed to air-dry before measurement. No chemical extraction, digestion, or coating was required. This is one of the practical advantages of the differential Raman approach over alternatives like X-ray fluorescence or chromatographic methods — it is fast, requires almost no consumables, and leaves the sample intact for any subsequent physical testing you need to run.
Published by ukugi.com Technical Team | Request a quote


