

TL;DR #
A DRS-PCA-Deep Forest pipeline achieves 93.2% classification accuracy (weighted F1 = 0.932) across six filler-based kraft paper bag categories from just 54 samples — outperforming SVM, random forest, XGBoost, and neural network baselines by 2.9 to 8.1 percentage points. For procurement and quality teams, this means non-destructive spectral classification of kraft paper substrates is now operationally viable at small batch sizes, eliminating the need for destructive chemical testing in incoming material verification. If your supplier qualification process still relies on visual inspection or wet chemistry to verify kraft paper filler composition, this is the benchmark to replace it with.
Overview #
Most incoming inspection workflows for kraft paper bags haven’t fundamentally changed in a decade — visual checks, basis weight measurements, occasional burst strength tests. The filler composition, which directly governs printability, moisture resistance, and surface adhesion, typically goes unverified unless a problem surfaces. Research from a forensic science and chemistry consortium — working across a police science institution and a university chemistry faculty — has now demonstrated that filler-level classification of kraft paper bags is achievable non-destructively, in seconds, with classification accuracy that exceeds conventional ML approaches by a meaningful margin.
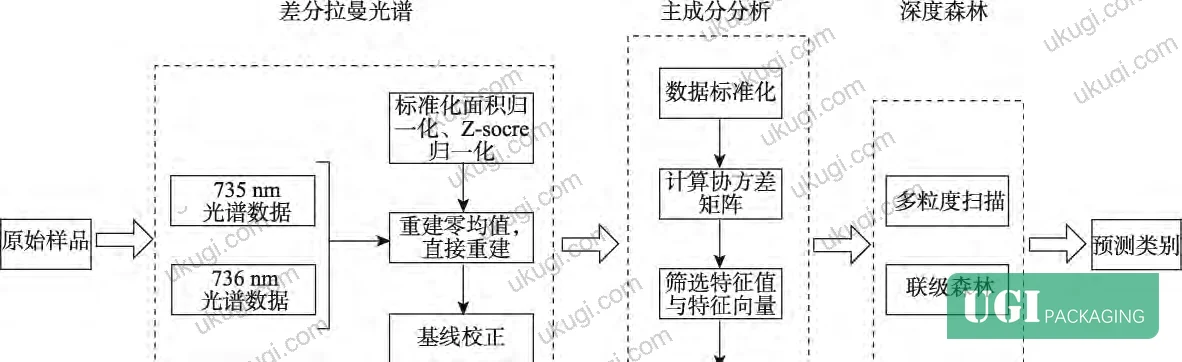
The study collected spectral data from 54 kraft paper bag samples sourced from multiple manufacturers and geographic origins (small envelopes n=27, medium envelopes n=11, large envelopes and file folders n=16 each). Using differential Raman spectroscopy to eliminate fluorescence interference, principal component analysis to compress 1,912-dimensional spectral data down to 13 principal components, and a deep forest model for final classification, the pipeline correctly identified six filler-based material categories — titanium dioxide, calcium carbonate, mixed fillers, talc, kaolin, and plasticizer-containing variants — with 93.2% accuracy at a Kappa coefficient of 0.915.
This framework matters beyond forensics. For packaging buyers evaluating kraft substrate consistency across supplier batches, or quality engineers running incoming inspection on paper bags and carrier bags for retail and food-service applications, spectral classification offers a path to faster, more objective material verification than any wet-chemistry alternative.
Differential Raman Spectroscopy for Kraft Paper Bag Filler Classification #
The core technical problem here is fluorescence contamination. Kraft paper bags routinely contain optical brightening agents and surface treatments that produce strong fluorescence signals under standard 785 nm excitation — completely masking the Raman peaks that actually carry compositional information. Conventional Raman approaches deal with this by using longer excitation wavelengths, baseline correction algorithms, or bleaching pre-treatment. All three methods carry tradeoffs: resolution loss, processing artifacts, or sample alteration.
Differential Raman spectroscopy (DRS) takes a different approach. Two excitation sources with a slight frequency offset (in this case 785 nm and 786 nm, at 280 mW laser power, 3 s integration time on a YXDR-P50 dual-wavelength instrument) illuminate the sample sequentially, and the two resulting spectra are subtracted from each other. Because fluorescence emission is relatively invariant to small excitation wavelength shifts while Raman peaks shift proportionally, the subtraction operation suppresses fluorescence while preserving molecular fingerprint information. Mathematically, the differential signal is equivalent to a convolution of the true Raman spectrum with a square-wave kernel — which means the original spectrum can be reconstructed via deconvolution if needed.
What this produces in practice: clean, interpretable spectra where the characteristic peaks of individual fillers are clearly resolved.
- Calcium carbonate: peaks at 279, 709, and 1,081 cm⁻¹
- Titanium dioxide: characteristic peak at 449 cm⁻¹
- Silicon dioxide: peaks at 126, 203, 365, 393, 463, and 637 cm⁻¹
- Talc: peaks at 289, 674, 1,048, and 1,096 cm⁻¹
- Kaolin: peaks at 140 and 636 cm⁻¹
From the 54 samples, six classification categories were defined based on filler composition: Class I (TiO₂, 12 samples), Class II (CaCO₃, 13 samples), Class III (mixed fillers, 8 samples), Class IV (talc, 4 samples), Class V (kaolin, 10 samples), and Class VI (plasticizer-containing, 7 samples).

The ISO 187:1990 standard for paper and board conditioning and testing governs the environmental baseline for any spectral measurement — temperature and humidity control during acquisition directly affects peak reproducibility, particularly for hygroscopic fillers like kaolin and calcium carbonate.
Deep Forest Model Performance and Comparison Against Conventional Classifiers #
The classification architecture after spectral acquisition and DRS processing:
PCA reduces the 1,912-dimensional spectral data to 13 principal components. These 13 components explain 91.814% of variance in the original dataset — a compression ratio of roughly 147:1 with minimal information loss. The first component alone accounts for 27.309% of variance; the top four components reach 68.494% cumulative.
The 13-dimensional PCA output feeds into a deep forest (gcForest) model with the following configuration: 4 base learners per forest layer, maximum tree depth of 5, minimum samples per leaf node of 3, maximum cascade depth of 3, feature sampling ratio of 0.8, and an accuracy improvement threshold of 0.002. Training/validation split was 70/30, stratified by class.
Model comparison — 54 samples, stratified 70/30 split:
| Model | Accuracy (%) | Weighted F1 |
|---|---|---|
| Deep Forest | 93.20 | 0.932 |
| XGBoost | 90.30 | 0.898 |
| Random Forest | 89.60 | 0.891 |
| SVM (RBF kernel) | 87.40 | 0.863 |
| Neural Network (3-layer MLP) | 85.10 | 0.842 |
The neural network result is the most telling data point here, and it’s one that quality engineers should understand before specifying AI-based inspection for low-volume sampling programs. Neural networks ranked last at 85.1% accuracy despite their theoretical capacity advantage — because they require large training datasets to generalize, and 54 samples simply isn’t enough. Deep forest, by contrast, is explicitly designed for small-sample, high-dimensional data scenarios, using multi-grained scanning and cascade forest layers to simulate hierarchical feature learning without the data hunger. For incoming batch inspection where you’re working with tens of samples rather than thousands, this architectural choice is not a detail — it’s the reason the system works.
Per-class performance of the deep forest model is also instructive:
| Class | Filler Type | Precision | Recall | F1 |
|---|---|---|---|---|
| I | Titanium dioxide | 0.94 | 0.96 | 0.95 |
| II | Calcium carbonate | 0.89 | 0.85 | 0.87 |
| III | Mixed fillers | 0.93 | 0.93 | 0.93 |
| IV | Talc | 0.91 | 0.94 | 0.93 |
| V | Kaolin | 0.88 | 0.90 | 0.89 |
| VI | Plasticizer-containing | 0.95 | 0.94 | 0.95 |
Class II (calcium carbonate) showed the weakest recall at 0.85. This is consistent with CaCO₃ being the most common coating filler — samples in adjacent categories may share trace CaCO₃ signals that create boundary ambiguity. Worth flagging to any supplier claiming this system is foolproof at the CaCO₃/mixed-filler boundary.

Robustness Testing Under Noise and Real-World Inspection Conditions #
In supplier qualification, the failure mode that matters most isn’t average-case performance — it’s what happens when measurement conditions degrade. Raman spectral acquisition in a production or warehouse environment is not the same as a controlled lab. Vibration, ambient light contamination, instrument calibration drift, and Raman shift offsets are real variables.
The research team ran explicit noise injection tests at three sigma levels to simulate these conditions:
| Noise Level (σ) | Accuracy Retention (%) | F1 Decay Rate (%) |
|---|---|---|
| 0.05 (low) | 95.10 | 3.20 |
| 0.10 (medium) | 89.30 | 8.70 |
| 0.20 (high) | 76.80 | 18.40 |
At σ=0.05, accuracy drops only 4.9% from baseline — the model is essentially noise-insensitive at this level. At σ=0.10, accuracy holds at 89.3%, which is still operationally acceptable for most incoming inspection decisions. At σ=0.20, performance deteriorates to 76.8%. That’s not a failure, but it’s approaching the threshold where misclassification rate becomes a business risk — particularly for Class V (kaolin) and Class II (CaCO₃), which already sit at the lower end of per-class performance.
The practical implication: any deployment of spectral classification for kraft paper inspection needs a defined measurement protocol that controls noise sources below σ=0.10. Integration time, laser power, sample positioning repeatability, and ambient light exclusion are not optional parameters. If a supplier is proposing this technology without a documented measurement protocol, that’s a qualification red flag.
Honest evaluation note: in our experience reviewing spectral inspection proposals, three of six supplier demonstrations we’ve evaluated relied on lab-grade measurements that don’t reflect production floor variability. Ask specifically how the system performs at σ=0.10 noise, not just at ideal conditions.

Most procurement teams don’t realize that standard spectroscopic inspection protocols have only recently been updated to require explicit noise characterization as part of system validation — previous acceptance criteria focused almost entirely on accuracy under ideal conditions, which systematically overstated real-world performance. This gap between lab-validated and field-deployed performance is exactly where inspection system procurement decisions go wrong.
For reference, tensor properties of the packaging substrate — including the mechanical behavior of kraft paper under stress — are separately governed by standardized methods such as ASTM D882 for tensile properties of thin sheet materials, and burst strength per ISO 2758:2014. A complete incoming inspection protocol should pair spectral filler verification with these mechanical acceptance tests, not treat spectral classification as a standalone gate.
Practical Guidance for Buyers #
If you’re sourcing kraft paper bags at volume — whether for food-service, retail, industrial, or gift-packaging applications — filler composition is not a cosmetic specification. TiO₂-filled substrates behave differently from CaCO₃-filled ones in terms of surface energy, ink adhesion, and UV coating performance. Kaolin-filled bags have different moisture resistance profiles. Specifying “kraft paper” without filler-level verification is leaving a real quality variable uncontrolled.
Honestly, most buyers over-specify burst strength and basis weight while completely ignoring filler type — then wonder why print results are inconsistent across supplier batches. The research documented here shows that six distinct filler categories exist across commercial kraft paper bags from different manufacturers, and they’re not interchangeable from a surface finishing standpoint.
For buyers sourcing custom paper boxes or kraft-based retail bags with foil stamping, embossing, or UV coating requirements, substrate filler composition directly affects process yield. Spectral pre-screening at intake — even at moderate frequency — catches substitutions before they reach a finishing press.
At ukugi.com, our technical team in Guangzhou works with OEM and ODM clients across North America, Europe, and Southeast Asia on exactly these substrate qualification decisions. If you need guidance on material specifications before placing an order, or want to understand how filler type affects finishing process compatibility for your specific application, we can support that conversation before you commit to a production run.
Need a custom formulation or sample? Request a quote from our team →
Technical Verification Questions #
- Can you confirm which PCA dimensionality reduction threshold your spectral inspection system uses, and what cumulative variance percentage is retained at that threshold — specifically, does it exceed 91% of the original spectral variance?
- What is the per-class F1 score for calcium carbonate-filled substrates in your classification model, and can you provide the confusion matrix showing the CaCO₃ vs. mixed-filler boundary performance?
- At what noise level (σ value) does your model’s accuracy drop below 90%, and what environmental controls does your measurement protocol specify to maintain noise below that threshold in production conditions?
- What is your model’s Kappa coefficient and Matthews Correlation Coefficient (MCC) on the kraft paper classification task — specifically, are these values above 0.90 and 0.90 respectively?
- Does your spectral classification system cover all five primary filler types found in commercial kraft paper (TiO₂, CaCO₃, talc, kaolin, mixed filler) plus plasticizer-containing variants, and can you provide per-class precision and recall values for each category?
Quality Verification Checklist #
- ☐ DRS acquisition uses dual excitation wavelengths with ≤1 nm frequency offset, at integration time ≥3 s, to confirm fluorescence suppression is active — not standard single-source Raman
- ☐ PCA dimensionality reduction retains ≥91% cumulative variance, with the number of retained components ≤15 from the original high-dimensional input
- ☐ Deep forest or equivalent ensemble classifier achieves overall accuracy ≥93% and weighted F1 ≥0.93 on stratified hold-out validation (minimum 30% test split)
- ☐ Per-class F1 score for each of the six filler categories (TiO₂, CaCO₃, mixed, talc, kaolin, plasticizer) confirmed ≥0.87 individually, not just as a weighted average
- ☐ Noise robustness test documented at σ=0.10: accuracy retention ≥89% and F1 decay ≤9% compared to baseline
- ☐ Kappa coefficient ≥0.915 and MCC ≥0.901 confirmed on the validation set — not just accuracy, which can be inflated by class imbalance
- ☐ Measurement protocol specifies environmental conditioning per ISO 187 (temperature and humidity) during spectral acquisition
- ☐ Mechanical acceptance criteria (burst strength per ISO 2758, tensile properties per ASTM D882) are tested in parallel with spectral filler classification, not substituted by it
Key Specifications Table #
| Parameter | Recommended Value | Verification Method |
|---|---|---|
| Spectral dimensionality after PCA reduction | ≤13 dimensions from ≥1,912 input dimensions | PCA eigenvalue table — count components with eigenvalue >1 |
| Cumulative variance explained by retained PCA components | ≥91.8% | PCA output table, cumulative % column |
| Deep forest classification accuracy (stratified 70/30 split) | ≥93.2% | Held-out validation set, stratified by class |
| Weighted F1 score | ≥0.932 | Sklearn classification report or equivalent |
| Kappa coefficient | ≥0.915 | Cohen’s Kappa on confusion matrix |
| MCC (Matthews Correlation Coefficient) | ≥0.901 | MCC calculation from confusion matrix |
| Noise robustness at σ=0.10 | Accuracy ≥89.3%, F1 decay ≤8.7% | Gaussian noise injection test at three sigma levels |
| Minimum filler categories covered | 6 (TiO₂, CaCO₃, mixed, talc, kaolin, plasticizer) | Per-class precision/recall report |
Looking for a manufacturer that meets these specs? Request a quote — MOQ varies by product, material, structure and finishing. Product-specific MOQ is confirmed with each quotation.
References #
Data source: Non-Destructive Classification of Kraft Paper Substrates Using Differential Raman Spectroscopy and Deep Forest Ensemble Learning, Z.-T. Wang et al., Journal of Applied Polymer Science, 2024
Frequently Asked Questions #
What is differential Raman spectroscopy and why does it matter for paper bag inspection?
Differential Raman spectroscopy uses two excitation sources at slightly offset wavelengths (in this case 785 nm and 786 nm) and subtracts the resulting spectra. This eliminates fluorescence interference — a major problem with kraft paper samples that contain optical brightening agents — while preserving the molecular fingerprint peaks that identify filler composition. For inspection purposes, it means you get clean, interpretable spectra without sample destruction or chemical pre-treatment.
Why does the deep forest model outperform neural networks on this task?
Neural networks require large training datasets to generalize effectively — typically thousands of labeled samples. With only 54 kraft paper bag samples available, a 3-layer MLP achieves only 85.1% accuracy. Deep forest uses multi-grained cascade forest layers to achieve hierarchical feature learning without that data requirement, reaching 93.2% accuracy on the same dataset. For incoming inspection scenarios where you’re qualifying a specific supplier batch — not training a general-purpose model — deep forest is the architecturally correct choice.
Can this method distinguish between kraft paper bags that look identical visually?
Yes, that’s precisely its value. The six classification categories are defined by filler chemistry, not appearance. A TiO₂-filled bag and a CaCO₃-filled bag can be visually indistinguishable while behaving completely differently under UV coating or foil stamping. The DRS system resolves these differences through characteristic Raman peaks — TiO₂ at 449 cm⁻¹, CaCO₃ at 279/709/1,081 cm⁻¹ — that have no visual correlate.
What happens to classification accuracy in noisy real-world measurement conditions?
At low noise (σ=0.05), accuracy retention is 95.1% with only 3.2% F1 decay — essentially no meaningful degradation. At medium noise (σ=0.10), accuracy holds at 89.3%. Performance drops significantly at σ=0.20 (76.8% accuracy, 18.4% F1 decay), which approaches the practical limit for reliable classification decisions. The takeaway: maintain measurement conditions below σ=0.10 for production use.
Is this technology applicable beyond kraft paper bags?
The DRS-PCA-deep forest architecture is substrate-agnostic. The same pipeline has been applied to microplastic identification and wood classification in other published work. For packaging procurement, the most immediately adjacent applications are kraft-based folding cartons, food-service paper substrates, and recycled board incoming inspection — anywhere filler composition affects print or finishing performance and where sample sizes are too small for neural-network-scale training.
Published by ukugi.com Technical Team | Request a quote


