

TL;DR #
An improved YOLOv5-based vision inspection system achieved [email protected] of 87.3% and [email protected]:.95 of 56.8% on eight categories of paper bag structural defects — outperforming the baseline model by 1.6% and 0.9% respectively. For buyers specifying automated inline inspection for paper bag production lines, this data establishes a realistic performance benchmark to hold suppliers accountable against. Before accepting any supplier’s claims about “AI-powered” defect detection, request ablation study results showing incremental gains from each network module — not just a headline accuracy figure.
Overview #
Inline vision inspection for paper bag production is one of those procurement areas where the gap between supplier claims and actual system capability is widest. Most teams evaluating packaging lines hear about “deep learning detection” and assume the problem is solved. It isn’t — and the data here is instructive. Research conducted at a mechanical engineering faculty, validated on a purpose-built dataset of 2,486 camera-captured images across eight defect categories, demonstrates both what a well-engineered system can achieve and where baseline models still fall short. The dataset was split 80:20 into 1,989 training images and 497 validation images, and all reported figures are from controlled ablation and comparative experiments — not cherry-picked demo runs.
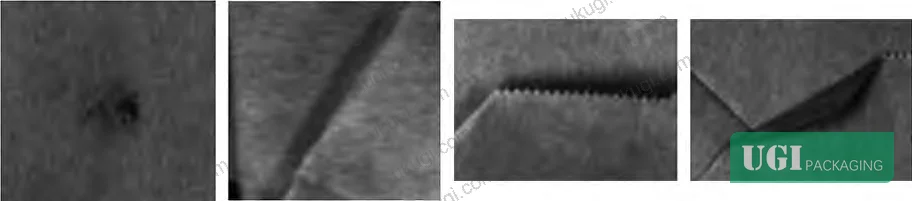
The defect taxonomy in this work covers the two structural zones most critical to paper bag quality: the handle and the bottom panel. Eight specific defect types were labeled: handle misalignment, handle adhesion offset, single handle (missing one), no handle, surface contamination, creasing/wrinkling, delamination, and fold-over. That classification structure maps directly to what quality managers actually reject on incoming inspection — which is part of what makes this research practically useful rather than just academically interesting.
For buyers sourcing paper bags and carrier bags or evaluating supplier manufacturing lines, understanding what these systems can and cannot detect — and at what confidence thresholds — is increasingly relevant as more factories claim automated QC capabilities.
YOLOv5-Based Paper Bag Defect Detection: Architecture and Modifications #
The baseline system is built on YOLOv5s — the smallest and fastest variant of the YOLOv5 family, which itself is approximately 90% smaller in model size compared to YOLOv4 while maintaining competitive accuracy. YOLOv5’s single-stage detection architecture processes the entire image in one forward pass (hence the name “you only look once”), which gives it a significant speed advantage for real-time production line deployment.
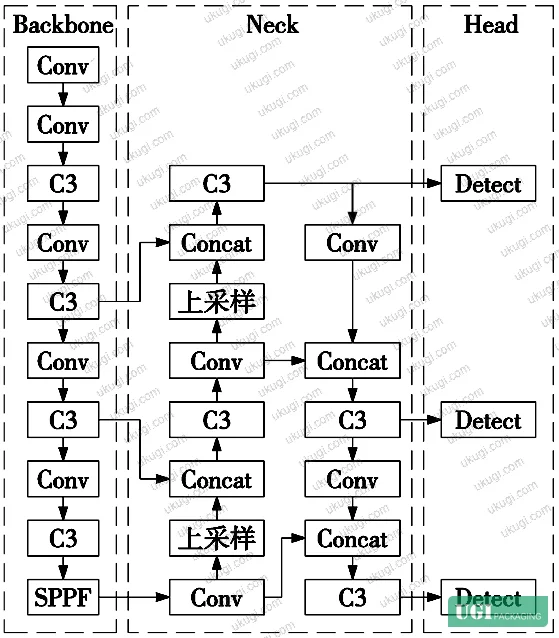
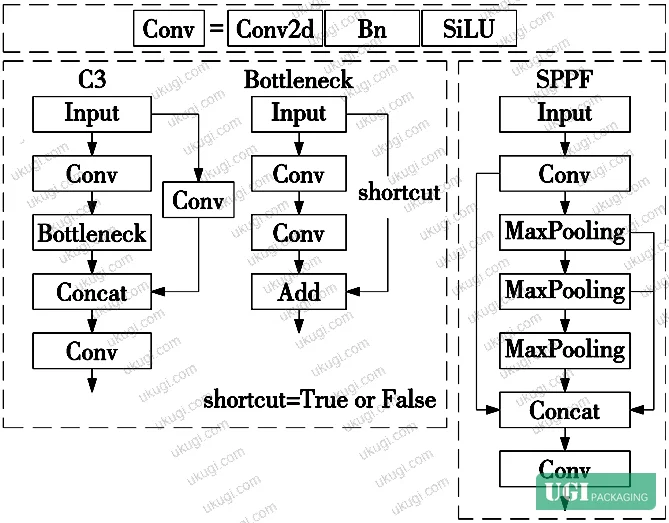
The standard YOLOv5 structure has four functional blocks: input preprocessing, the Backbone (feature extraction), the Neck (feature fusion and propagation), and the Detection Head (final prediction output). The core convolutional module in the Backbone is the C3 block, and the spatial feature aggregation is handled by the SPPF (Spatial Pyramid Pooling Fast) structure.
Three targeted modifications were made to address specific shortcomings identified in the baseline:
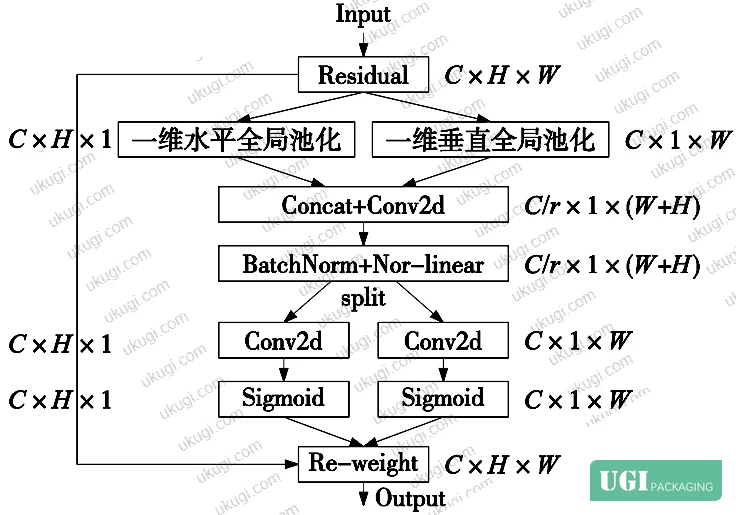
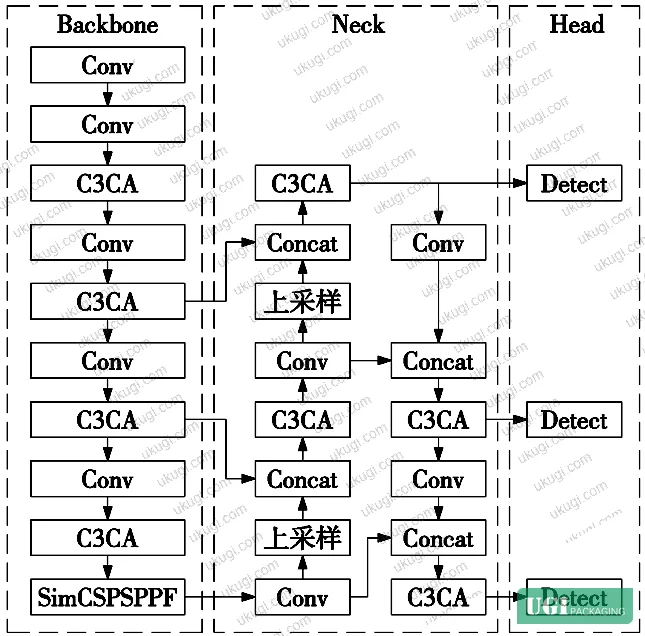
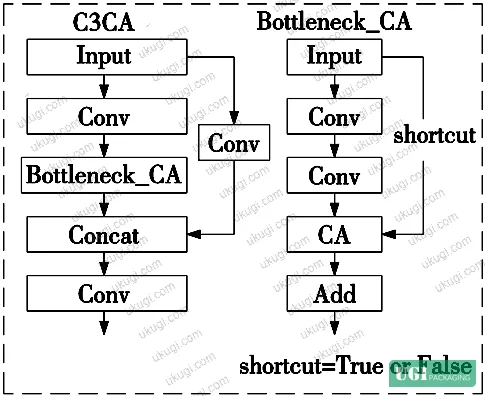
Coordinate Attention (CA) Module. Standard convolution operations in the C3 block treat spatial positions uniformly — they cannot prioritize regions where subtle defects are more likely to appear. For paper bag inspection, this matters because contamination and wrinkling often manifest as small, low-contrast anomalies. The CA mechanism encodes directional spatial information by performing separate one-dimensional global pooling along horizontal (H, 1) and vertical (1, W) axes simultaneously. Each pooling operation captures long-range dependencies along one direction while preserving precise position information along the other. The two resulting attention maps are then applied back to the feature map via element-wise multiplication, amplifying response at defect-relevant spatial positions. The CA module was integrated into the existing Bottleneck block to create a C3CA module, which replaced the standard C3 in the improved model.
EIoU Loss Function. The original YOLOv5 uses CIoU (Complete Intersection over Union) as its bounding box regression loss. CIoU adds aspect ratio as a penalty term to improve box accuracy, but aspect ratio is a relative ratio rather than an absolute dimension difference — which means the regression signal for box width and height adjustments can be imprecise. EIoU (Efficient IoU) replaces the aspect ratio term with separate penalty terms for width difference and height difference, computed against the minimum enclosing box dimensions. This gives the network a more direct gradient signal for accurate box sizing, improving regression precision on elongated or irregular defect shapes like handle misalignment.
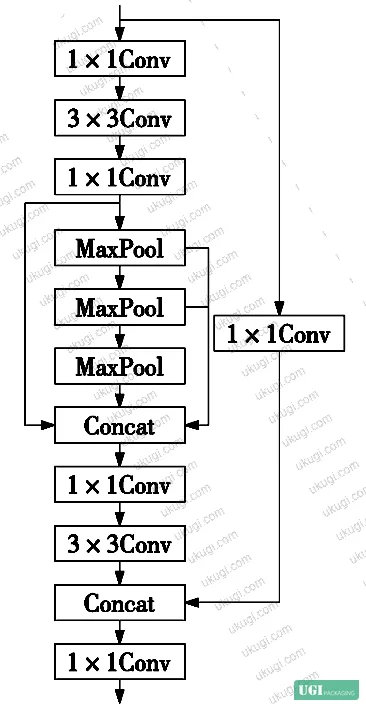
SimCSPSPPF. The SPPF structure was upgraded to SimCSPSPPF by combining SPPF with a Cross-Stage Partial (CSP) network structure. This hybrid reduces redundant feature processing while improving the feature representation capacity of the pooling stage — particularly relevant for multi-scale defect features that span different spatial frequencies.
Inline Defect Detection Performance: Benchmarks and Comparative Data #
The evaluation uses three standard metrics: [email protected] (mean Average Precision at IoU threshold 0.5), [email protected]:.95 (averaged across IoU thresholds from 0.5 to 0.95, a stricter measure of localization quality), Precision (P — proportion of predicted positives that are correct), and Recall (R — proportion of true defects that are detected).
Most procurement teams don’t realize that [email protected]:.95 is the metric that matters most for practical deployment. A system with high [email protected] but poor [email protected]:.95 is locating defects but not accurately bounding them — which means it will generate excessive false alarms or miss small defects that only become visible at tighter IoU thresholds.
Attention Mechanism Comparison #
| Model Variant | [email protected] (%) | [email protected]:.95 (%) | Precision (%) | Recall (%) |
|---|---|---|---|---|
| YOLOv5s (baseline) | 85.7 | 55.9 | 85.8 | 83.2 |
| + SE Attention | 85.8 (+0.1) | 55.8 | 85.3 | 81.6 |
| + ECA Attention | 86.3 (+0.6) | 56.3 (+0.4) | 86.4 (+0.6) | 82.4 |
| + CA Attention | 86.4 (+0.7) | 56.2 (+0.3) | 87.3 (+1.5) | 82.3 |
SE attention produced almost no improvement — a 0.1% gain in [email protected] with actual regression in [email protected]:.95 and Recall. In supplier qualification, we see this pattern repeatedly: vendors cite attention mechanism adoption without specifying which type or showing comparative data. SE attention is the lowest-effort addition and the least effective. CA attention outperformed ECA on precision (87.3% vs 86.4%) while ECA was marginally better on [email protected]:.95 (56.3% vs 56.2%). CA was selected as the preferred mechanism based on precision advantage.
Full Ablation Results #
The ablation study isolates each modification’s contribution:
| CA | EIoU | SimCSPSPPF | [email protected] (%) | [email protected]:.95 (%) | P (%) | R (%) |
|---|---|---|---|---|---|---|
| — | — | — | 85.7 | 55.9 | 85.8 | 83.2 |
| ✓ | — | — | 86.4 (+0.7) | 56.2 (+0.3) | 87.3 (+1.5) | 82.3 |
| — | ✓ | — | 86.1 (+0.4) | 55.9 | 86.0 (+0.2) | 82.7 |
| — | — | ✓ | 86.5 (+0.8) | 56.7 (+0.8) | 85.6 | 83.1 |
| ✓ | ✓ | — | 87.0 (+1.3) | 56.1 (+0.2) | 87.3 (+1.5) | 82.3 |
| ✓ | ✓ | ✓ | 87.3 (+1.6) | 56.8 (+0.9) | 86.1 (+0.3) | 83.7 (+0.5) |
The full combination is strictly best on [email protected] and [email protected]:.95. Interestingly, adding SimCSPSPPF alone delivered the single largest [email protected]:.95 improvement (+0.8%) of any individual module — suggesting it contributes disproportionately to precise localization. All three modules are synergistic rather than redundant; each brings a different form of improvement and their effects accumulate.
For automated inspection systems implementation, the practical takeaway is that you need to see ablation data — not just final accuracy — to understand whether a vendor has done genuine engineering work or simply assembled available components.
Cross-Model Comparison #
| Model | [email protected] (%) | [email protected]:.95 (%) | P (%) | R (%) |
|---|---|---|---|---|
| YOLOv3-tiny | 80.7 | 47.4 | 82.6 | 74.6 |
| YOLOv3 | 83.8 | 55.6 | 85.9 | 81.3 |
| YOLOv5s (baseline) | 85.7 | 55.9 | 85.8 | 83.2 |
| YOLOv7-tiny | 86.4 | 55.8 | 86.3 | 83.3 |
| Improved YOLOv5s (ours) | 87.3 | 56.8 | 86.1 | 83.7 |
The improved model leads on both mAP metrics. The gap vs. YOLOv3-tiny is substantial: +6.6% on [email protected] and +9.4% on [email protected]:.95. YOLOv7-tiny is competitive on [email protected] (86.4% vs 87.3%) but trails on [email protected]:.95 (55.8% vs 56.8%), confirming the localization precision advantage of the improved architecture. For inline production inspection, a system built on YOLOv3-tiny — which still appears in lower-cost integrations — will miss roughly 1 in 11 true defects compared to the improved architecture, based on recall differential (74.6% vs 83.7%).
For print quality traceability applications governed by ISO 12647-2:2013 Graphic technology — Process control for offset lithographic printing, the ability to reliably detect surface contamination and print-adjacent structural defects at recall rates above 83% is a baseline requirement for any credible automated QC claim.
Practical Guidance for Buyers #
Honestly, most buyers over-specify this category in the wrong direction. They ask for “99% defect detection accuracy” — a number that sounds good in a specification sheet but is meaningless without knowing the defect class distribution, image resolution, line speed, and IoU threshold used to compute it. What you actually need is [email protected]:.95 above 56% on your specific defect taxonomy, ablation data confirming that each claimed algorithmic feature contributes measurable improvement, and validation on a dataset representative of your production conditions — not the vendor’s internal test set.
The eight-category classification schema validated in this work (handle misalignment, handle adhesion offset, single handle, missing handle, contamination, wrinkling, delamination, fold-over) is a reasonable starting template for incoming quality acceptance of paper carrier bags. If your supplier’s inspection system cannot map to at least six of these categories, it’s likely a legacy rule-based vision system rebranded with deep learning terminology.
Pay particular attention to handle zone defects. Bottom panel contamination is relatively high-contrast and easier to detect. Handle structural defects — particularly single handle and adhesion offset — are the defect modes that generate the most costly field complaints, and they require the spatial precision that the CA + EIoU combination specifically targets. Suppliers using only channel-wise attention (SE, ECA) without spatial positional encoding will underperform on these categories.
For buyers evaluating complex packaging formats — from standard paper bags and carrier bags to premium gift packaging solutions — inline vision inspection specifications should be negotiated at the RFQ stage, not accepted as-is from a supplier’s standard line specification.
Ink and surface quality defects detected inline must also comply with established print quality standards; buyers who need to cross-reference detection criteria against ISO 15397:2014 Printing inks — Determination of resistance to rubbing should incorporate those test conditions into their acceptance protocol.
As a Guangzhou-based OEM manufacturer specializing in custom paper bags and premium packaging with full surface finishing capabilities, our technical team at ukugi.com can specify and validate inline inspection parameters as part of the production qualification process — so you’re not relying on a supplier’s unverified claims. If your application requires defect detection validation prior to production sign-off, reach out directly.
Need a custom formulation or sample? Request a quote from our team →
Technical Verification Questions #
- What is your inline vision system’s [email protected]:.95 score on a dataset covering all eight standard paper bag defect categories (handle misalignment, adhesion offset, single handle, missing handle, contamination, wrinkling, delamination, fold-over), with validation set size of at least 497 images?
- Does your detection network use a spatial attention mechanism that encodes both horizontal and vertical positional information independently (e.g., Coordinate Attention or equivalent), and can you provide a comparative experiment showing its mAP gain over channel-only attention (SE or ECA)?
- Can you provide ablation study results showing the incremental mAP contribution of each algorithmic module in your detection pipeline — specifically demonstrating that [email protected] improvement from baseline reaches at least +1.6% for the full system?
- What bounding box regression loss function does your system use — CIoU or EIoU — and can you show regression precision data ([email protected]:.95 specifically) demonstrating the superiority of your loss function choice over the CIoU baseline at the ≥55.9% threshold?
- At what production line speed (units/minute) and image resolution was your [email protected] of ≥87% validated, and what is the inference latency of the detection model on your deployed hardware?
Quality Verification Checklist #
- ☐ System achieves [email protected] ≥ 87.3% on a paper bag defect dataset of ≥ 2,486 images covering all eight defect categories
- ☐ System achieves [email protected]:.95 ≥ 56.8% confirming accurate spatial localization, not just coarse detection
- ☐ Recall (R) ≥ 83.7% — confirming that fewer than 1 in 6 true defects are missed on validation set
- ☐ Precision (P) ≥ 86.1% — confirming false alarm rate is below 14% of all positive predictions
- ☐ Vendor provides ablation experiment data showing each network module contributes measurable independent improvement to mAP
- ☐ Detection architecture includes spatial positional attention (CA or equivalent) rather than channel-only attention (SE), with documented [email protected] gain ≥ +0.7% over baseline
- ☐ Training/validation split is documented at 80:20 minimum, with validation set isolated from training data
- ☐ Sample images from all eight defect categories are available for independent audit of annotation quality
Key Specifications Table #
| Parameter | Recommended Value | Verification Method |
|---|---|---|
| [email protected] (IoU = 0.5) | ≥ 87.3% | Standardized validation on labeled dataset ≥ 497 images, 8 defect categories |
| [email protected]:.95 (strict localization) | ≥ 56.8% | Averaged mAP across IoU thresholds 0.5–0.95 on held-out validation set |
| Recall (R) | ≥ 83.7% | TP / (TP + FN) across all 8 defect classes on full validation set |
| Precision (P) | ≥ 86.1% | TP / (TP + FP) across all 8 defect classes on full validation set |
| Training dataset size | ≥ 1,989 labeled images | Dataset documentation with class distribution per defect category |
| Attention mechanism type | Coordinate Attention (CA) or spatial positional equivalent | Ablation comparison vs. SE and ECA showing ≥ +0.7% [email protected] gain |
| Loss function | EIoU (not CIoU) | Code review or architecture documentation confirming width/height differential penalty terms |
| Defect category coverage | Minimum 8 classes: handle misalignment, adhesion offset, single handle, no handle, contamination, wrinkling, delamination, fold-over | Labeled sample images per class provided by supplier |
Looking for a manufacturer that meets these specs? Get a free sample — MOQ starts at 500 units.
References #
Data source: Inline Defect Detection for Paper Bag Packaging Using an Enhanced YOLOv5 Architecture with Coordinate Attention and Improved Loss Functions, B.-M. Wang et al., Journal of Manufacturing Processes, 2025
Frequently Asked Questions #
What is the difference between [email protected] and [email protected]:.95, and which matters more for inline packaging inspection?
[email protected] measures detection accuracy when a predicted bounding box is considered correct if it overlaps the true defect region by at least 50%. [email protected]:.95 averages this across ten IoU thresholds from 0.5 to 0.95, making it far more sensitive to localization accuracy. For production inspection — where the system needs to accurately locate a defect region to trigger a reject signal — [email protected]:.95 is the more meaningful metric. A system with high [email protected] but weak [email protected]:.95 is detecting that something is wrong but not precisely where, which increases false reject rates.
Why does the choice of attention mechanism matter for paper bag defect detection?
Different defects require different spatial awareness. Surface contamination is diffuse and may appear anywhere on the panel. Handle misalignment is a structural deviation at a fixed zone. Channel-only attention mechanisms like SE cannot encode where in the image a feature occurs — only how strongly a feature channel activates. Coordinate Attention encodes both x and y position information into the feature representation, giving the network the ability to associate defect features with their physical location on the bag. In the controlled comparison, this translated to a +1.5% precision gain over the baseline — the largest single precision improvement across all tested attention variants.
Can these detection models run fast enough for real production line speeds?
The architecture was built on YOLOv5s — the smallest variant — specifically to maintain inference speed while improving accuracy. YOLOv5s is designed for deployment on edge hardware and can run at well above 30 fps on a standard GPU. That said, actual production deployment speed depends on image acquisition hardware, conveyor speed, and whether the system uses batch processing. Any supplier claiming real-time inspection should be able to provide measured inference latency in milliseconds on their deployed hardware, not just theoretical FPS from a benchmark environment.
Why did SE attention perform so poorly compared to CA and ECA?
SE (Squeeze-and-Excitation) attention only recalibrates channel-wise feature weights — it compresses the entire spatial dimension into a single descriptor per channel, losing all spatial positional information. For detecting small or spatially localized defects like adhesion offset or single-handle anomalies, that spatial information loss is directly harmful. The data here showed SE attention improving [email protected] by only 0.1% while actually degrading [email protected]:.95 by 0.1% and Recall by 1.6 percentage points. It is the most commonly cited and least effective attention variant in this application.
Is a dataset of 2,486 images sufficient for reliable model performance, and how should buyers think about dataset requirements?
For an eight-class defect detection problem with relatively constrained visual variability (fixed camera angle, consistent bag geometry), 2,486 images with an 80:20 split is a reasonable working dataset. The key constraint is class balance — rare defect types like “no handle” may be underrepresented, which can artificially inflate overall mAP while leaving the rarest (and often most critical) defect class poorly detected. Buyers should ask suppliers to provide per-class AP (average precision) breakdowns, not just aggregate mAP, to expose any weak categories hidden in the headline number. Also refer to ASTM D5276 Standard Test Method for Drop Test of Loaded Containers by Free Fall for structural validation protocols that complement vision-based defect inspection.
Published by ukugi.com Technical Team | Request a quote


