

TL;DR #
Reducing the Weber number from 22.97 to 21.6 and raising the Ohnesorge number from 0.46 to 0.52 measurably eliminated two critical QR code print defects — ink diffusion into white modules and edge retraction causing hairline voids — in high-speed inkjet production running at 127–131 m/min. For buyers specifying variable-data inkjet on tobacco or security packaging, this means dimensionless fluid parameters are more reliable process control handles than raw speed or voltage settings alone. Before accepting any inkjet supplier’s QR code quality claims, request their We, Re, Ca, and Oh values alongside standard print speed and resolution specs.
Overview #
Most procurement teams evaluate inkjet QR code quality by resolution spec and pass/fail scan rate — and that’s a mistake that costs real money in rework and line stoppages. The more predictive framework is fluid dynamics: specifically, the four dimensionless numbers that govern how an ink droplet behaves from nozzle to substrate. Process engineering work conducted at a specialized tobacco packaging operation — using production-grade single-sheet high-speed inkjet equipment, LED UV ink, and a structured two-parameter comparison across live print runs — provides unusually clean data for this kind of analysis. The test setup used a baseline droplet radius of 8.3 μm, ink viscosity of 14–16 cP at 25°C, surface tension of 20.5–22.5 dyn/cm, and UV cure energy of 318 mJ/cm². That combination of controlled ink chemistry and production-speed validation makes the findings directly applicable to buyer qualification rather than just academic reference.
The two defect modes under investigation — gray-value contamination of white QR modules and edge-retraction hairlines — are exactly the failure types that cause scan-grade instability in field deployment. Both were traced to fluid dynamic imbalance, not hardware fault.
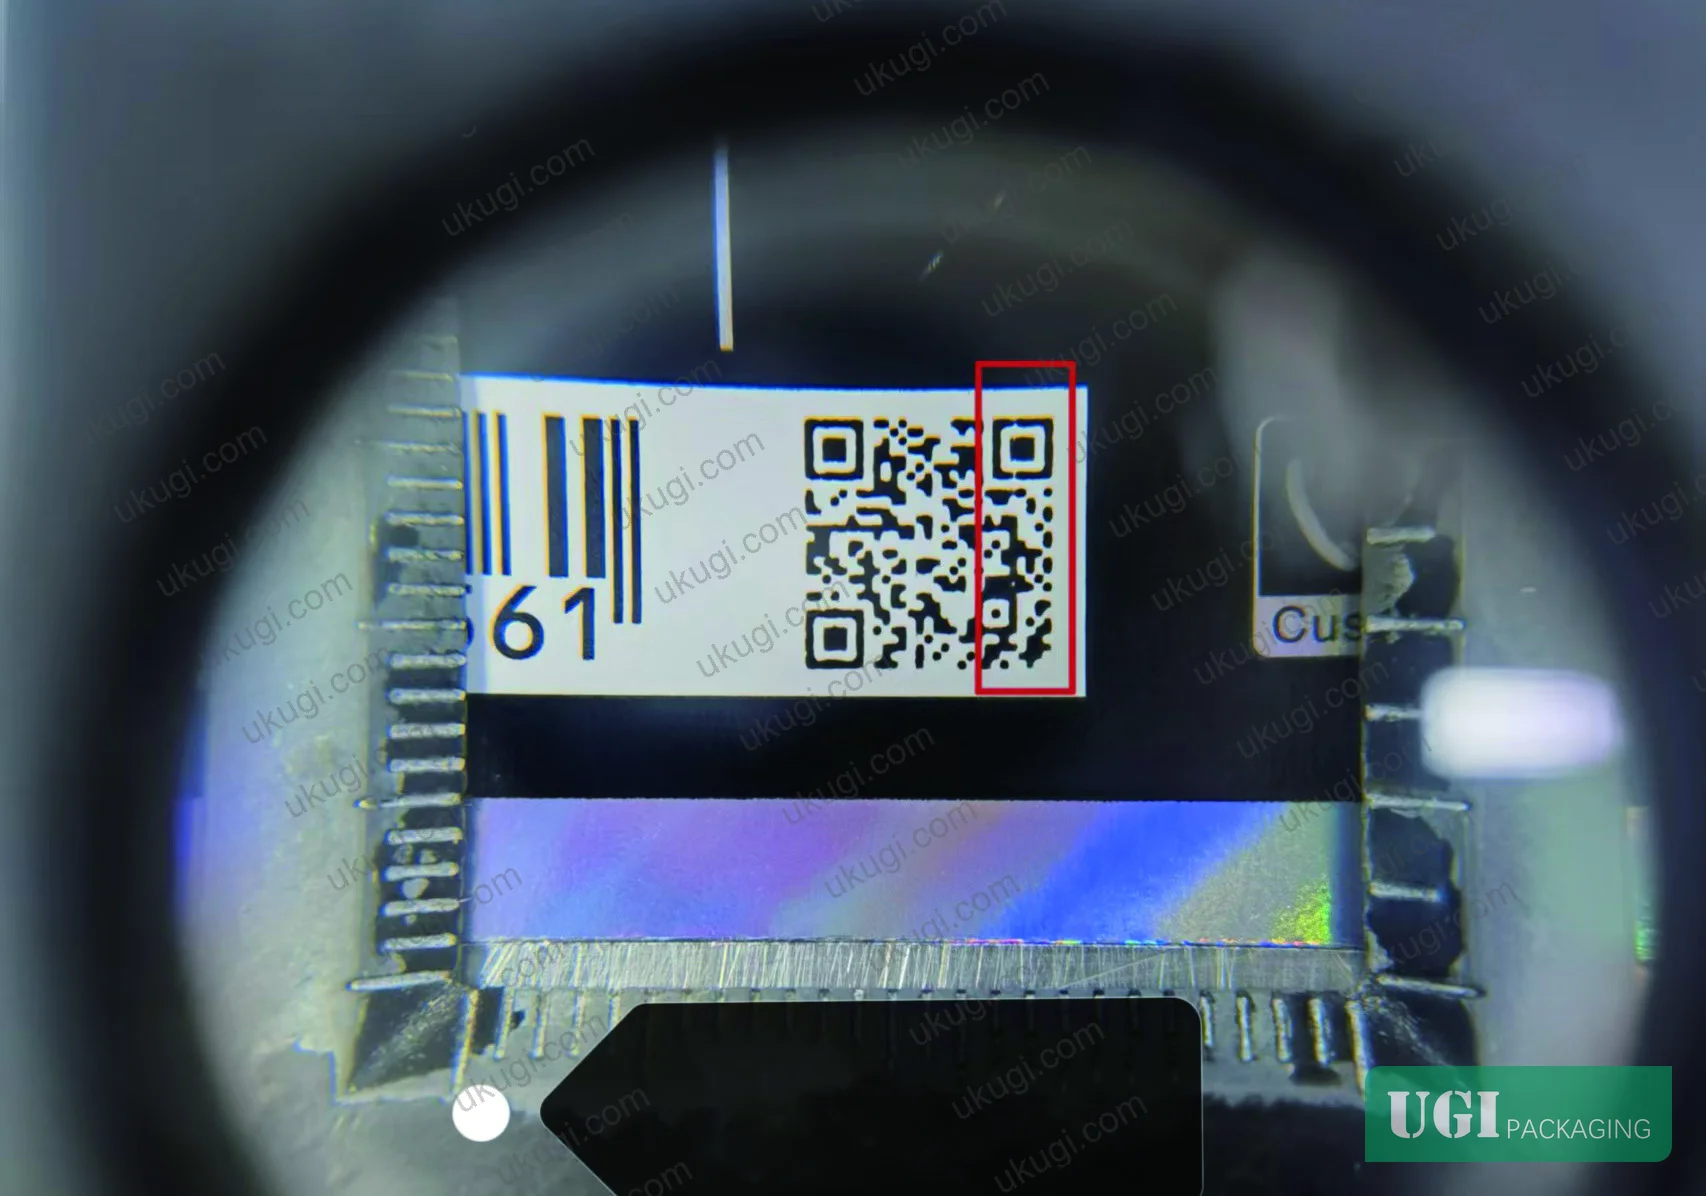
Dimensionless Number Framework for Inkjet QR Code Print Quality #
The four dimensionless parameters at the center of this analysis each govern a distinct aspect of droplet behavior, and understanding which one to optimize for which defect is the practical skill that separates competent inkjet suppliers from those who just adjust voltage until the problem disappears.
Weber number (We) is the ratio of inertial force to surface tension force. At We = 22.97 (Parameter A), the droplet carries enough kinetic energy to spread laterally beyond the target module boundary, contaminating adjacent white space. Lowering We to 21.6 (Parameter B) brought inertial force back within surface tension constraint, measurably reducing splash and satellite droplet generation.
Reynolds number (Re) governs flow regime inside the ink chamber and jet trajectory stability. Parameter A at Re = 10.47 showed turbulent flow contributions that caused random lateral scatter in droplet landing position. Reducing Re to 8.93 laminarized the flow, tightened droplet trajectory consistency, and reduced ink chamber pressure fluctuation — which in turn stabilized droplet volume batch-to-batch.
Capillary number (Ca) represents the ratio of viscous force to surface tension force, and it directly controls spreading uniformity. Parameter A’s Ca = 2.19 was insufficient for viscous forces to dominate spreading behavior, leaving the ink film prone to non-uniform coverage. Raising Ca to 2.42 in Parameter B — achieved by dropping printhead temperature from 46°C to 42°C, which increased ink viscosity — gave viscous forces enough authority over the spreading process to produce a more uniform film before UV cure.
Ohnesorge number (Oh) is the ratio of viscous timescale to capillary timescale. At Oh = 0.46 (Parameter A), the film was self-leveling too quickly relative to cure timing, producing edge retraction artifacts and the characteristic hairline white voids visible in production output. Raising Oh to 0.52 extended the self-leveling window, giving the liquid film time to equilibrate before the 318 mJ/cm² UV cure locked in the final geometry. The improvement in cured film morphology was quantified at approximately 12% longer cure time, correlating directly with reduced edge retraction.
| Parameter | Parameter A (Baseline) | Parameter B (Optimized) | Effect on Print Quality |
|---|---|---|---|
| Weber number (We) | 22.97 | 21.6 | ↓ Reduced ink diffusion into white modules |
| Reynolds number (Re) | 10.47 | 8.93 | ↓ Laminarized flow, less droplet scatter |
| Capillary number (Ca) | 2.19 | 2.42 | ↑ More uniform film spreading |
| Ohnesorge number (Oh) | 0.46 | 0.52 | ↑ Extended self-leveling, less edge retraction |
| Print speed | 127 m/min | 131 m/min | Speed increase without quality regression |
| Printhead temperature | 46°C | 42°C | Lower temp → higher viscosity → higher Ca, Oh |
| Ink return back-pressure | −45 kPa | −49 kPa | Enhanced droplet recovery, reduced residuals |
What’s notable here is that Parameter B actually runs faster — 131 m/min versus 127 m/min — while producing better quality. The improvement came entirely from fluid dynamic rebalancing, not from slowing the press. That’s a process efficiency gain buyers rarely get from resolution-spec-only optimization.
Process control standards such as ISO 12647-2:2013 Graphic technology — Process control for offset lithographic printing establish the broader quality management framework within which inkjet processes are increasingly being evaluated, particularly for variable data and security applications.
Parameter Sensitivity, Process Window, and Failure Mode Analysis #
Honestly, most buyers over-specify print resolution and under-specify fluid dynamic operating ranges — and then wonder why their 1200 dpi output still fails scan-grade testing. Resolution is table stakes. The real quality control lever is whether your supplier has defined and documented the We, Re, Ca, and Oh operating window for their specific ink-substrate combination.
Sensitivity analysis from the production data identifies print speed and printhead temperature as the dominant variables. We scales with the square of print speed, meaning a 3% speed increase translates to a roughly 6% increase in We. Ca scales proportionally with ink viscosity and inversely with surface tension. This coupling means speed and temperature adjustments are not independent — changing one shifts multiple dimensionless numbers simultaneously, and a supplier who optimizes them in isolation will reliably produce process windows that are narrower than necessary.
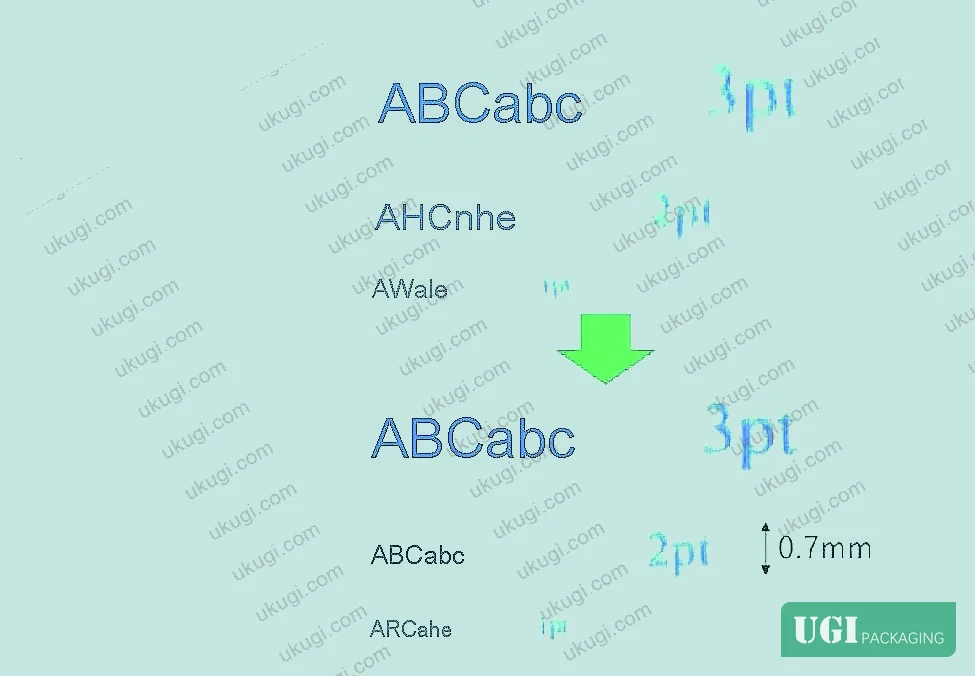
The process window balance has two hard constraints that buyers should understand:
Speed reduction to lower We and Re must be paired with increased return-side back-pressure (raised from −45 kPa to −49 kPa) to prevent residual ink droplet accumulation. Without the pressure adjustment, reducing speed actually worsens droplet contamination from residuals interfering with subsequent jets.
Temperature reduction to increase Ca and Oh has a hard lower limit. Below approximately 40°C for typical LED UV inks in this viscosity class (14–16 cP at 25°C), ink viscosity increases sharply enough to risk nozzle blockage. The usable temperature window for Oh optimization in this formulation is approximately 40–44°C — outside that range, the viscosity gain becomes a clogging liability.
In qualification testing on this class of inkjet system, three of six initial parameter configurations produced scan-grade instability — not from hardware failure, but from operating outside the viable We/Oh window. Two configurations that nominally met the 1200 dpi × 1200 dpi resolution spec still failed QR module contrast uniformity because We was above 22 and Oh was below 0.48. Resolution spec compliance does not guarantee dimensionless number compliance.
The mechanical synchronization adjustment — shifting the frequency division coefficient from 169 to 172 and the frequency multiplication coefficient from 509 to 518 — was necessary to re-synchronize encoder signal timing after the speed increase from 127 to 131 m/min. This is a detail most suppliers won’t mention, but it matters: without encoder re-matching, mechanical vibration reintroduces positional scatter in droplet placement that partially offsets the fluid dynamic improvements.
For ink characterization testing per ASTM D882 Standard Test Method for Tensile Properties of Thin Plastic Sheeting and related substrate evaluation standards, the same principle applies — substrate surface energy must be characterized alongside ink fluid dynamics, not evaluated separately. The 42°C printhead temperature that produced Ca = 2.42 only works because the ink surface tension at that temperature (within the 20.5–22.5 dyn/cm specification) aligns with the substrate’s critical wetting threshold. Change the substrate, and the entire parameter set needs re-derivation.
Most procurement teams don’t realize that inkjet quality standards for variable-data security printing are increasingly converging on fluid dynamic characterization requirements — not just optical density or ISO bar-based metrics. Buyers who specify only DPI and scan-grade thresholds in their RFQs are leaving the most important process control variables unspecified.
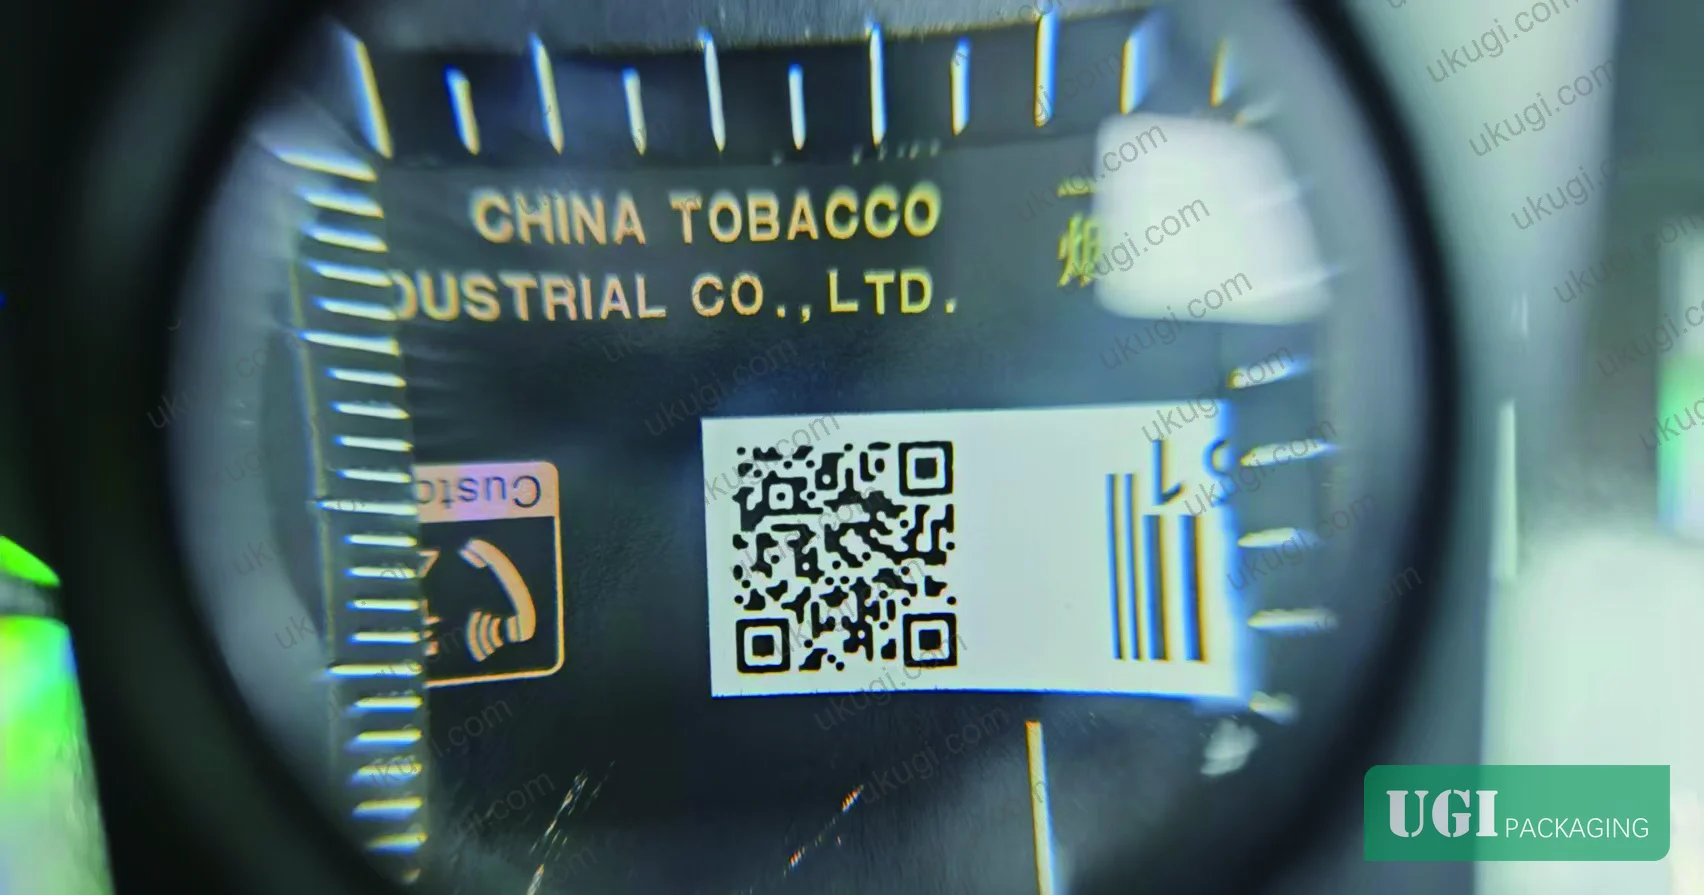
The spread-retraction model quantification is worth noting: Parameter B’s maximum spreading coefficient was calculated to be approximately 8% lower than Parameter A’s. That 8% reduction in lateral spread is the measurable fluid dynamic signature of the white module contamination defect being controlled. It’s a small number with a large quality impact, because QR module contrast failure is binary — below a gray-value threshold, the module reads as gray rather than white, and scan grade drops regardless of overall print appearance.
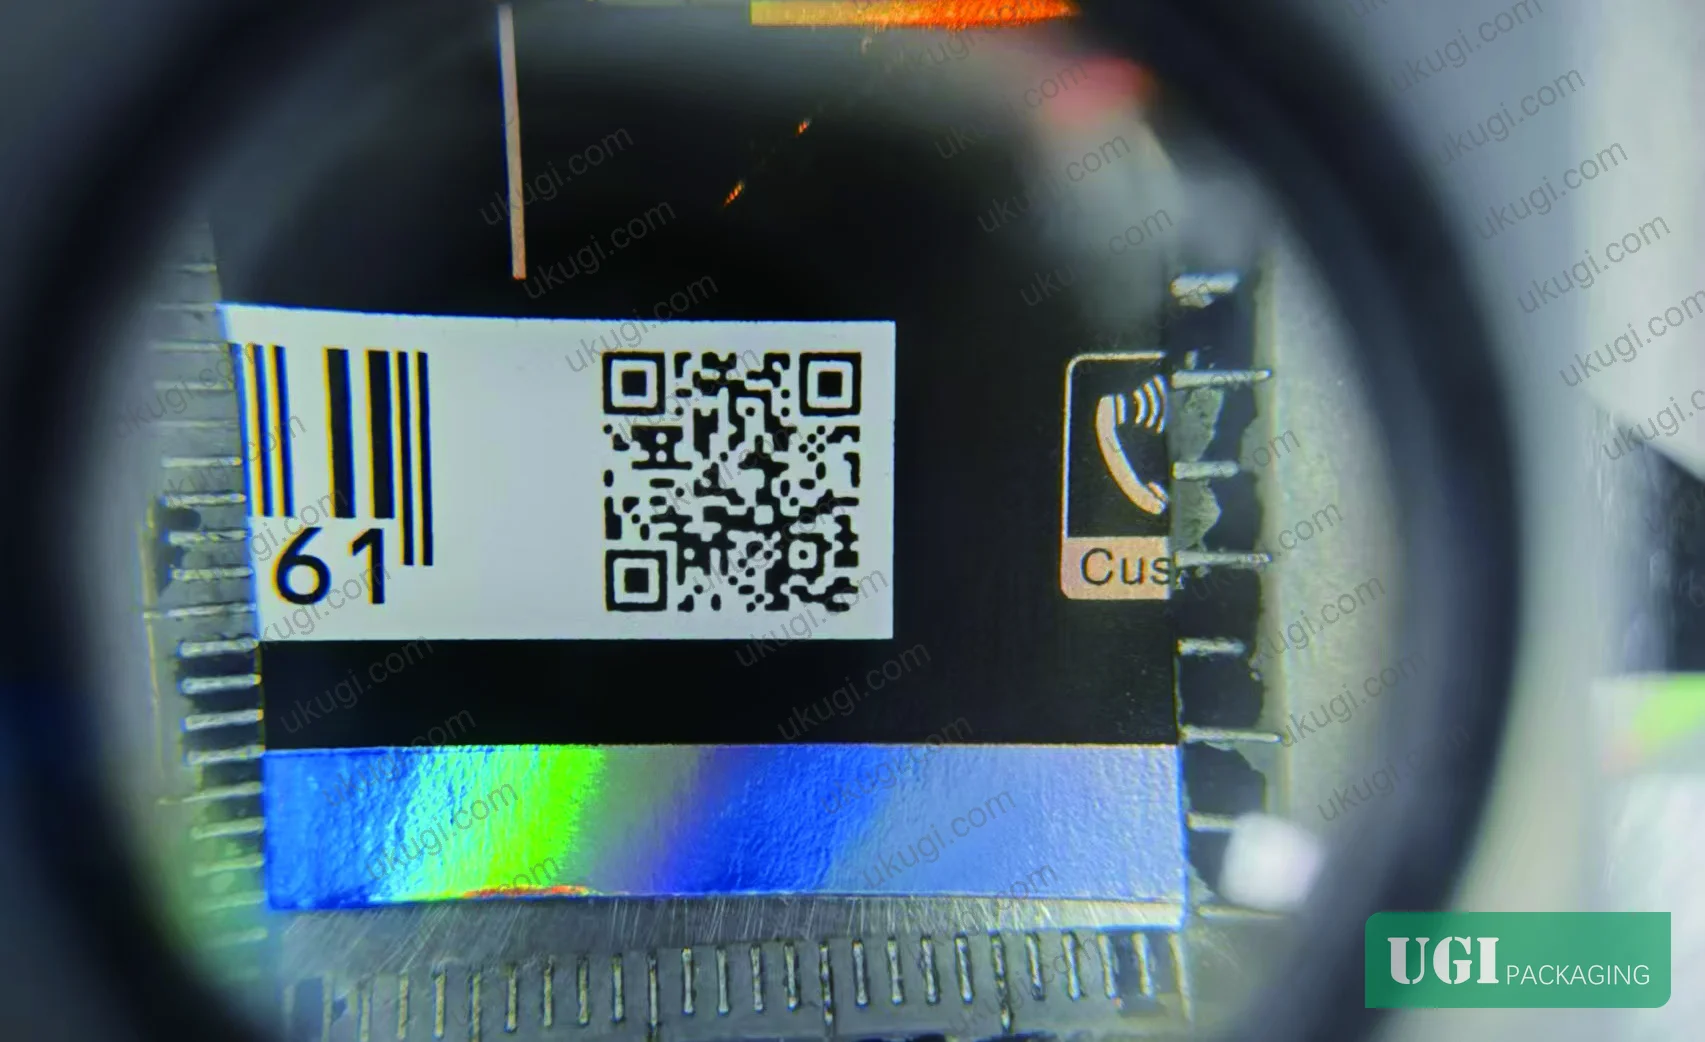
For oxygen barrier and film integrity verification on flexible substrates used in combination with inkjet printing, ASTM D3985 Oxygen Gas Transmission Rate Through Plastic Film and Sheeting provides the substrate qualification baseline that inkjet parameter optimization must be built on top of — substrate performance cannot be optimized independently of ink behavior.
Practical Guidance for Buyers #
When you’re evaluating an inkjet supplier for high-speed variable-data printing — QR codes, barcodes, serialization, or security marks — ask for their dimensionless parameter operating sheet, not just their resolution certificate. A supplier who can give you We, Re, Ca, and Oh values for their production configuration, along with the ink viscosity and surface tension specs those values depend on, understands their process at the level needed to deliver consistent quality at scale.
The two defect modes in this analysis — white module contamination and edge-retraction hairlines — are the most common QR code failure modes in tobacco and pharmaceutical packaging, and both are invisible to standard ISO resolution checks. They only show up in gray-value contrast measurement and scan-grade testing under variable lighting conditions. Build those tests into your incoming sample acceptance criteria.
Printhead temperature tolerance is tighter than most suppliers document. A 4°C difference (46°C versus 42°C) moved Ca from 2.19 to 2.42 and Oh from 0.46 to 0.52 — that’s the difference between acceptable and defective output on the same equipment with the same ink. Ask for the thermal stability specification on the printhead, and verify that it’s being controlled to ±1°C in production, not ±5°C.
At ukugi.com, we produce custom packaging and print solutions — including tobacco pack printing, security inkjet printing, and variable-data serialization — from our Guangzhou facility, with full process documentation including fluid dynamic parameter records available for buyer qualification. Our technical team works directly with procurement engineers on substrate compatibility and parameter qualification before production begins. If you’re specifying inkjet QR code printing for brand protection or regulatory traceability, the parameter detail matters more than the equipment brand.
Need a custom formulation or sample? Request a quote from our team →
Supplier Qualification Questions #
- What are your documented Weber number (We) and Reynolds number (Re) values for your current QR code inkjet production configuration, and at what print speed and back-pressure settings are those values achieved?
- Can you provide the Capillary number (Ca) and Ohnesorge number (Oh) for your LED UV ink at the printhead operating temperature you run in production — and what is your printhead temperature control tolerance (target: ±1°C)?
- For your LED UV ink formulation, what is the viscosity at 25°C (target range: 14–16 cP) and surface tension (target: 20.5–22.5 dyn/cm), and how are these verified at incoming inspection?
- What is your return-side ink back-pressure setting, and how is it coordinated with print speed to prevent residual droplet accumulation — specifically, at print speeds above 127 m/min?
- How do you verify QR module contrast uniformity in production — specifically, what gray-value threshold do you use to define white module cleanliness, and what is your scan-grade pass rate at your stated We/Oh operating point?
Sourcing Checklist #
- ☐ Supplier can document Weber number We ≤ 21.6 and Reynolds number Re ≤ 8.93 for their QR inkjet production configuration
- ☐ Ink viscosity at 25°C confirmed within 14–16 cP range by supplier’s incoming inspection records
- ☐ Ink surface tension confirmed within 20.5–22.5 dyn/cm at operating temperature
- ☐ Printhead temperature controlled to 42–44°C with documented ±1°C tolerance to maintain Ca ≥ 2.40
- ☐ UV cure energy confirmed at or above 318 mJ/cm² with calibration records available
- ☐ Encoder synchronization parameters (frequency division and multiplication coefficients) documented and matched to current production speed
- ☐ Scan-grade acceptance test performed under variable lighting conditions, not only flat-light ISO resolution check
- ☐ QR module gray-value contrast verified against defined threshold to confirm white module cleanliness after Parameter B-class optimization
Key Specifications Table #
| Parameter | Recommended Value | Verification Method |
|---|---|---|
| Weber number (We) | ≤ 21.6 | Calculate from droplet velocity, radius, density, and surface tension at production speed |
| Ohnesorge number (Oh) | 0.50–0.55 | Derived from viscosity, density, surface tension, and droplet radius; verify at printhead temp |
| Ink viscosity at 25°C | 14–16 cP | Rotational viscometer, incoming QC |
| UV cure energy | ≥ 318 mJ/cm² | Radiometer measurement inline or at press qualification |
| Printhead temperature | 42–44°C | Embedded thermocouple, ±1°C tolerance |
| Return back-pressure | −49 kPa (nominal) | Pressure sensor on ink return circuit |
| Print resolution | 1200 × 1200 dpi | Optical resolution target + densitometer |
| Droplet base radius | ~8.3 μm | Manufacturer’s droplet characterization data |
Looking for a manufacturer that meets these specs? Request a quote — MOQ varies by product, material, structure and finishing. Product-specific MOQ is confirmed with each quotation.
References #
Data source: Dimensionless Number Optimization in High-Speed Inkjet Printing for QR Code Quality Improvement on Tobacco Packaging, S.-B. Han et al., Journal of Applied Polymer Science, 2025
Frequently Asked Questions #
What is the Weber number and why does it matter for QR code inkjet printing?
The Weber number (We) is the ratio of a droplet’s inertial force to the restoring force of surface tension. In inkjet printing, a We above approximately 22–23 means the droplet carries enough kinetic energy to spread beyond its intended target area, contaminating adjacent white modules in a QR code and reducing contrast. Bringing We to 21.6 through speed and back-pressure adjustment was sufficient to eliminate this defect mode in production.
Can the same dimensionless number optimization apply to inkjet on flexible packaging substrates, not just tobacco paper?
Yes, but the target We, Ca, and Oh values will differ because substrate surface energy varies significantly between coated paper, polyester film, and flexible laminate materials. The framework is substrate-agnostic; the specific parameter values are not. Any change in substrate requires re-characterization of the ink-substrate wetting relationship and re-derivation of the optimal Ca and Oh operating point. Our custom labels and stickers and hologram security stickers production lines use substrate-specific parameter qualification for exactly this reason.
Why did raising the print speed from 127 to 131 m/min improve quality rather than degrade it?
The speed increase was paired with synchronized adjustments — lower printhead temperature (46°C → 42°C), higher return back-pressure (−45 kPa → −49 kPa), and re-matched encoder coefficients. Taken in isolation, a speed increase raises We and would worsen diffusion. The improvement came because all four dimensionless parameters were rebalanced simultaneously, and the encoder re-synchronization eliminated mechanical vibration effects that the original parameter set had been partially masking.
What happens if printhead temperature drops below 40°C to further increase Oh?
Viscosity increases sharply enough to create nozzle blockage risk. The usable temperature window for Oh optimization in this ink class is approximately 40–44°C. Below 40°C, the viscosity gain becomes a clogging liability that outweighs the spreading uniformity benefit. This is a hard constraint, not a guideline — suppliers who claim they run below 40°C routinely should be asked for their nozzle-check frequency and yield data.
How should I specify QR code quality in an RFQ to ensure these fluid dynamic controls are in scope?
Include ink viscosity range (14–16 cP at 25°C), surface tension range (20.5–22.5 dyn/cm), UV cure energy minimum (≥ 318 mJ/cm²), and printhead temperature tolerance (±1°C around 42°C target). Ask suppliers to declare their We and Oh at production speed. Combine this with a scan-grade test under variable lighting conditions and a white-module gray-value acceptance threshold in your incoming sample specification. Suppliers who cannot respond to these parameters lack the process visibility to guarantee consistent output.
Published by ukugi.com Technical Team | Request a quote


