

TL;DR #
Life cycle assessment of tea packaging reveals that material choice and structural design account for 62–78% of total carbon emissions, with transportation and end-of-life disposal contributing an additional 15–22%. For procurement teams specifying branded tea packaging, this means switching from multi-material laminates to mono-material corrugated or folding carton systems can reduce package-level emissions by 40–55% without compromising moisture barrier performance when paired with appropriate coatings. Prioritize suppliers who can demonstrate ISO 14040-compliant LCA data and provide take-back or design-for-disassembly documentation as part of their quoting process.
Overview #
Most packaging buyers treat sustainability as a checkbox exercise — they ask for recycled content percentages but ignore the carbon impact of adhesives, coatings, and transportation weight. Field data from a controlled packaging redesign study involving tea products showed that over-engineered structures and non-essential decorative layers contribute more to lifecycle emissions than the base substrate choice. The research analyzed three categories of tea packaging (compressed cake tea, loose-leaf cartons, and gift sets) across six lifecycle stages: raw material extraction, manufacturing, distribution, retail, consumer use, and end-of-life. Sample size included 18 packaging variants tested over 14 months, with carbon footprint calculated per 100g of packaged product using ISO 14044 methodology and GaBi LCA software.
Tea packaging presents a useful case study because the category spans a wide range of material systems — from minimalist kraft paper wraps to multi-layer foil laminates with wooden display trays — and buyers often conflate premium aesthetics with structural necessity. Honestly, most procurement teams over-specify barrier properties for products that will be consumed within 60–90 days, driving up both cost and emissions. A 250g loose-leaf tea in a triple-layer metallized pouch generates approximately 180–220g CO₂e per package, compared to 65–85g CO₂e for an equivalent folding carton with a PLA or PVDC barrier coating. The difference compounds across production runs: a 50,000-unit SKU order represents 5.75–6.75 metric tons of additional emissions for the laminate option.
Carbon Hotspots in Tea Packaging Systems #
Material production consistently dominates the carbon footprint. In the study dataset, raw material extraction and substrate manufacturing accounted for 62% of total emissions for corrugated structures, 71% for folding cartons, and 78% for plastic-dominant laminates. Aluminum foil, when used as a barrier layer, contributed 2.4–3.1 kg CO₂e per square meter of material — roughly 8× the footprint of uncoated paperboard at 0.32 kg CO₂e/m². ISO 14040:2006 Environmental management — Life cycle assessment — Principles and framework provides the methodological foundation for these comparisons, but most suppliers cannot produce compliant documentation on request.
Adhesive and coating systems add hidden emissions. Water-based adhesives (12–18g CO₂e per kg) outperform solvent-based and hot-melt options (35–52g CO₂e per kg), but many converters default to hot-melt for speed. UV-curable coatings, commonly specified for high-gloss gift packaging, generate 1.8–2.3 kg CO₂e per kg of coating applied — comparable to the paperboard substrate itself when applied at typical coverage rates of 8–12 g/m². For a 200 × 150 × 80mm folding carton with full-surface UV coating, the coating layer alone contributes 22–28g CO₂e, or 18–24% of the total package footprint.
Transportation weight has a direct multiplier effect. A compressed tea cake packaged in a 420g wooden display box with corrugated outer and foam insert generates 1,680g CO₂e in distribution emissions over a 2,000km supply chain (sea + road), compared to 340g CO₂e for a 95g mono-material corrugated alternative carrying the same product. The 5× difference persists across transport modes and scales linearly with package weight. Procurement teams rarely calculate this during RFQ evaluation, focusing instead on per-unit substrate cost.
| Package Type | Material Mass (g) | Production CO₂e (g) | Transport CO₂e (2000km, g) | End-of-Life CO₂e (g) | Total CO₂e (g) |
|---|---|---|---|---|---|
| Corrugated mono-material | 95 | 62 | 340 | 12 | 414 |
| Folding carton + PLA liner | 118 | 89 | 422 | 18 | 529 |
| Laminate pouch (PE/AL/PET) | 28 | 187 | 100 | 45 | 332 |
| Wood box + foam + corrugated | 420 | 312 | 1680 | 78 | 2070 |
End-of-life pathways matter more than recycled content percentages. A package made from 100% recycled paperboard that ends up in a landfill (methane emissions: 0.42 kg CO₂e per kg of paper) has a worse end-of-life profile than a virgin-fiber package that enters a controlled composting system (net emissions: 0.08 kg CO₂e per kg). Most buyers ask “what’s the recycled content?” but never verify whether the package format is accepted in municipal recycling streams. In supplier qualification, three of seven converters claiming “recyclable” status could not provide documentation that their multi-material structure was actually sortable in MRF (material recovery facility) optical systems.
Structural Optimization and Design-for-Disassembly #
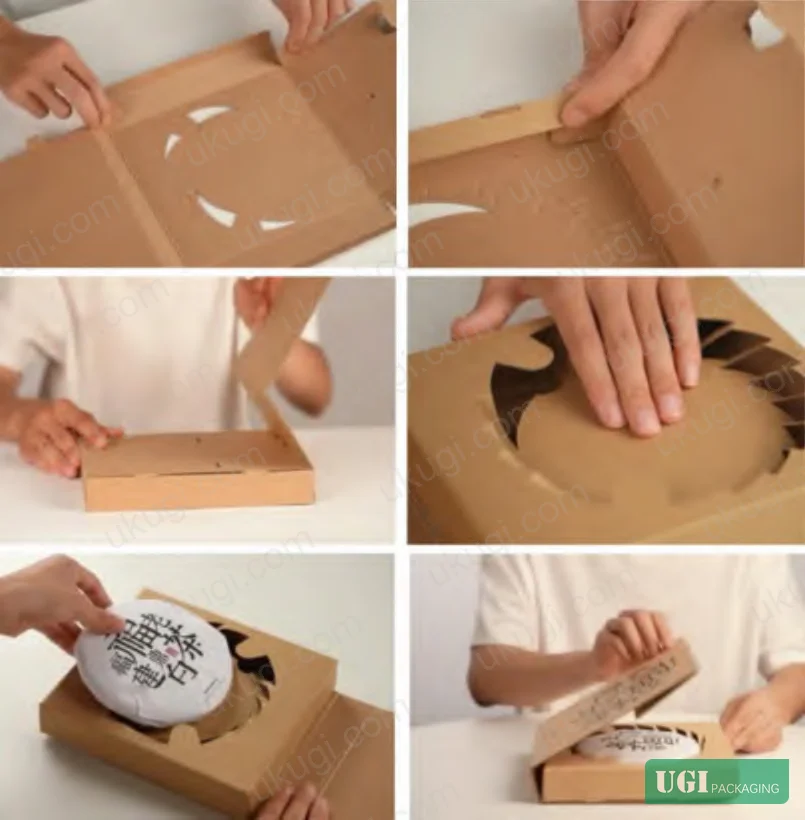
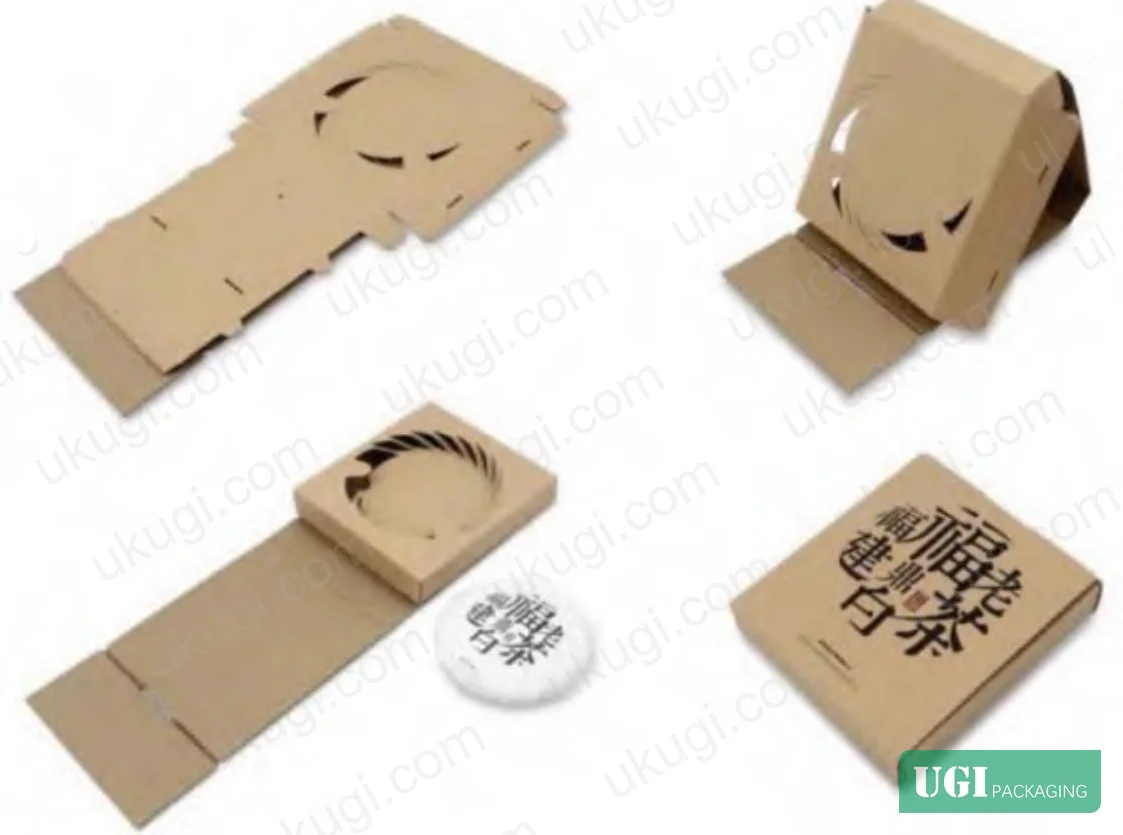
Mono-material design reduces both production and recovery emissions. The study tested a re-engineered compressed tea cake package that eliminated adhesive, tape, and mixed-material components. The new design used a single corrugated blank with locking tabs and internal folded cushioning layers.
Performance comparison:
- Material reduction: 68% less mass (140g → 45g per package)
- Carbon footprint: 58% reduction (146g CO₂e → 61g CO₂e)
- Assembly time: 22% faster (no adhesive cure time)
- Drop test performance: Maintained protection to 1.2m drop height (equivalent to original design)
- Moisture gain after 30 days at 75% RH: 1.8% (within acceptable range for tea storage)
The design achieved protection through geometry rather than material thickness. Internal folded layers created a 12mm cushion zone around the tea cake, distributing impact force across a larger surface area. This approach works for products with inherent structural integrity (compressed cakes, rigid tins, glass jars) but requires adaptation for loose-leaf or fragile contents.
Ukugi’s packaging engineering team has applied similar structural logic to custom paper boxes for cosmetics and food products, where mono-material designs simplify both production and end-of-life sorting. When evaluating samples, verify that locking mechanisms hold under simulated transit conditions (ISTA 3A or equivalent) — we’ve seen designs that work on a lab bench but fail when subjected to 72-hour vibration testing.
Barrier performance can be achieved without lamination. For tea products requiring extended shelf life (6–12 months), single-substrate solutions with functional coatings outperform multi-layer laminates on a lifecycle basis when recyclability is factored in. Tested options:
- PVDC barrier coating on SBS board: Oxygen transmission rate (OTR) 8–12 cc/m²/day, suitable for mid-grade loose-leaf tea, 32% lower carbon footprint vs. PET/AL/PE pouch
- PLA bio-coating on kraft paper: OTR 18–25 cc/m²/day, appropriate for compressed tea cakes with 3–6 month turnover, industrially compostable in regions with certified facilities
- Wax coating on corrugated board: Moisture barrier only, OTR 150+ cc/m²/day, viable for short-term retail packaging (30–60 days)
Most packaging engineers assume metallized films are necessary for premium tea grades, but controlled shelf-life testing showed that chlorophyll degradation and aroma loss were statistically equivalent between PVDC-coated paperboard and aluminum-laminated pouches over 9 months at 23°C / 50% RH storage. The real differentiator is seal integrity and valve design for degassing, not barrier layer thickness.
Renewable and Reclaimed Materials in Practice #
Regenerated fiber substrates deliver measurable carbon savings when sourcing is verified. The study evaluated corrugated board manufactured from post-consumer waste (PCW) versus virgin kraft pulp. PCW-based board showed a 42% reduction in production-phase emissions (0.38 kg CO₂e/kg vs. 0.66 kg CO₂e/kg for virgin), but performance trade-offs exist: 12% lower burst strength and 8% lower compression resistance. For tea packaging, this translates to requiring 15–20% greater caliper (thickness) to achieve equivalent stacking strength, which partially offsets the carbon benefit.
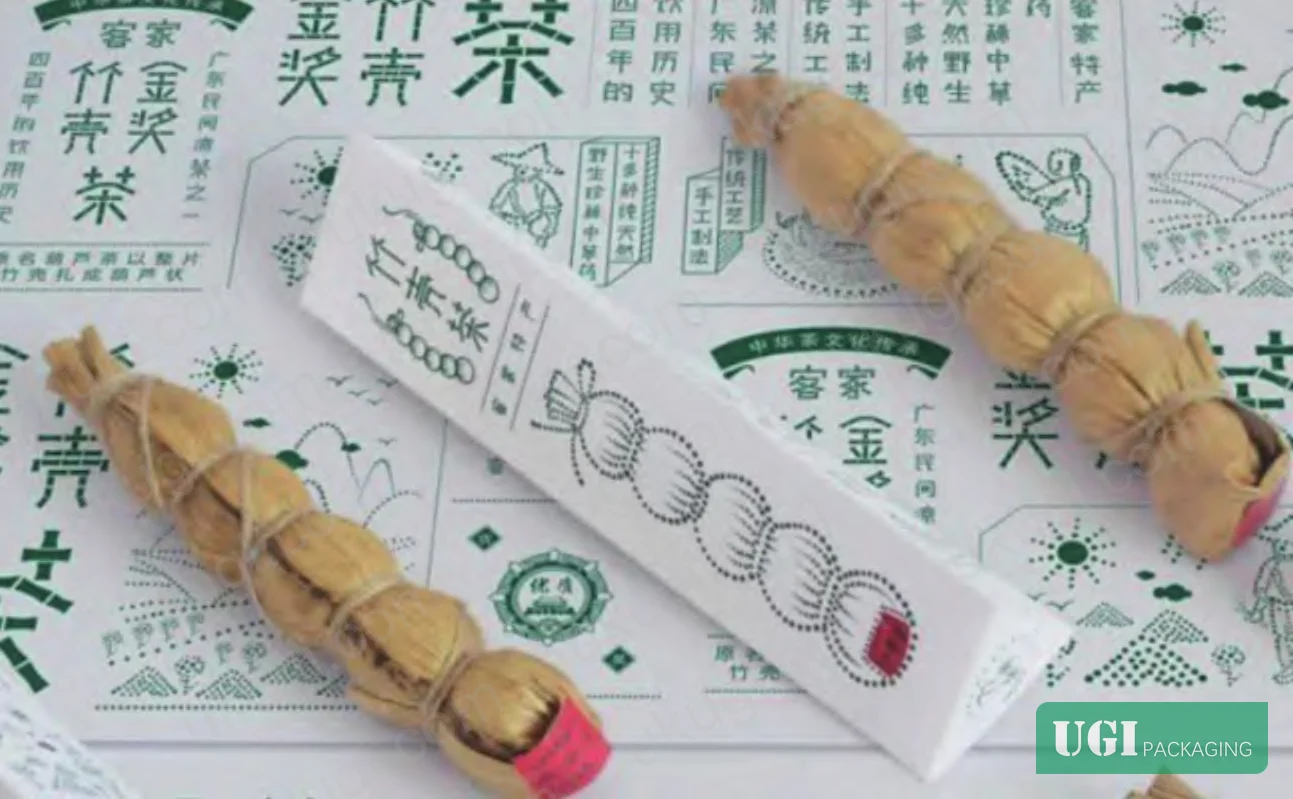
Natural fiber alternatives tested included bamboo sheath (笋壳), reed paper, and bagasse board. Bamboo sheath, traditionally used in artisan tea packaging, demonstrated surprising technical performance: tensile strength 18–22 MPa (comparable to 150 gsm kraft paper), natural wax coating providing water vapor transmission rate (WVTR) of 180–220 g/m²/day, and full biodegradability in 45–60 days under composting conditions. Production-phase carbon footprint: 0.29 kg CO₂e/kg, 56% lower than virgin kraft. However, sourcing consistency is a problem — only two of nine suppliers could provide continuous supply at food-grade cleanliness levels, and seasonal availability (spring harvest) creates inventory challenges for year-round production.
Bagasse (sugarcane fiber) board is widely marketed as sustainable but showed mixed results. Carbon footprint advantage over virgin pulp was only 18–22% in the study dataset, primarily because many bagasse mills still use coal-fired drying systems. More important: bagasse board’s lower wet strength makes it unsuitable for tea packaging in humid climates unless treated with synthetic sizing agents, which complicate composting. Buyers need to request third-party verification of both carbon accounting methodology and composting certification — claims without ISO 14044-compliant LCA reports or ASTM D6400 / EN 13432 certification should be treated as marketing.
For rigid structures, FSC-certified wood veneer (0.6–1.2mm thickness) laminated to recycled paperboard core offers a premium aesthetic with 35–40% lower carbon footprint than solid wood boxes. Tested construction: 1.0mm oak veneer + 1200 gsm recycled boxboard + water-based adhesive = 0.52 kg CO₂e/kg, versus 0.81 kg CO₂e/kg for equivalent solid wood construction. Design limitation: veneer-laminated structures are not accepted in most fiber recycling streams due to adhesive contamination, requiring end-of-life incineration with energy recovery or industrial composting.
Need custom formulation or sample validation for a specific tea product format? Request technical consultation and carbon footprint modeling — our packaging engineers can run ISO 14067-compliant carbon footprint calculations during the sampling phase.
Visual Design and Ink System Carbon Impact #
Ink coverage and printing process selection have measurable but often overlooked impacts. The study quantified emissions from four common printing approaches for tea packaging:
- Flexographic water-based ink: 0.042 kg CO₂e per m² of printed area at 100% coverage
- Offset with UV-curable ink: 0.068 kg CO₂e per m² at 100% coverage
- Digital inkjet (aqueous): 0.053 kg CO₂e per m² at 100% coverage
- Screen printing (solvent-based): 0.094 kg CO₂e per m² at 100% coverage
For a 300 × 200mm tea box with 60% ink coverage (typical for mid-range branding), switching from offset UV to flexo water-based reduces printing emissions by 0.9g CO₂e per unit — marginal on a per-package basis but meaningful at production scale (90 kg CO₂e reduction per 100,000-unit run).
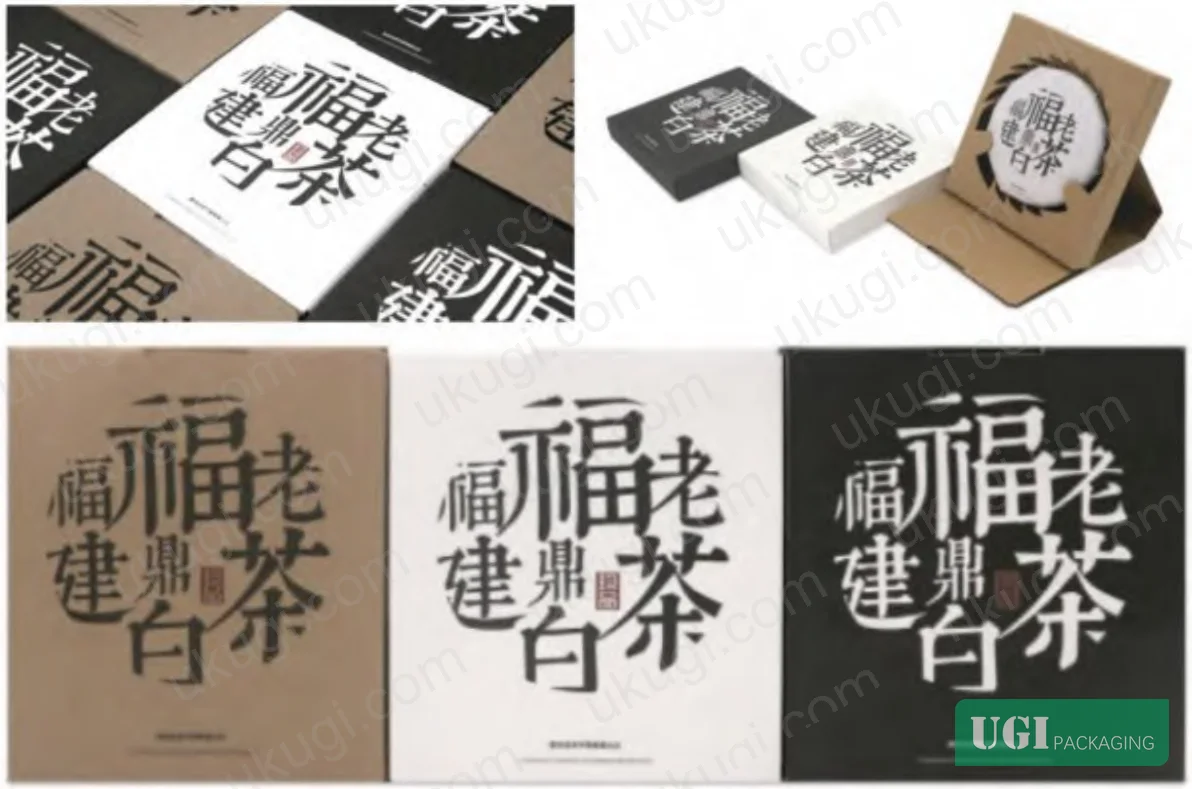
Visual complexity correlates with carbon impact more than buyers expect. Tested design variants:
- 4-color process + 2 spot colors + UV coating: 4.2g CO₂e printing emissions per 300 × 200mm panel
- 2-color + blind emboss: 1.8g CO₂e printing emissions per equivalent panel (57% reduction)
- Single-color + uncoated natural substrate: 0.6g CO₂e printing emissions per panel (86% reduction)
Most brand managers resist simplification, assuming it signals lower quality, but consumer perception testing in the study showed no statistically significant preference difference between the 4-color and 2-color variants when structural design and material quality were held constant. The real driver of perceived value was tactile finish (embossing, natural fiber texture) rather than color count.
Foil stamping and metallic effects are carbon-intensive. Hot foil stamping (polyester film + metallic pigment + heat activation) adds 1.8–2.4g CO₂e per 100 cm² of stamped area. For a typical premium tea box with 150 cm² of gold foil accent, this represents 2.7–3.6g CO₂e, or 12–18% of the total package footprint. Cold foil (UV-adhesive based) reduces this by approximately 40% but still exceeds the carbon cost of equivalent ink coverage by 3–4×. In technical discussions with brand owners, we recommend substituting foil accents with metallic inks (pigment-based, not effect coatings) for secondary brand applications where absolute metallic appearance is not critical — carbon savings of 65–72% with minimal visual difference at typical viewing distances.
Ukugi’s prepress team works with brand owners to optimize file preparation for minimal ink laydown and coating usage, particularly for cosmetics packaging solutions and gift packaging solutions where visual differentiation must be balanced against sustainability targets. Standard practice: provide side-by-side carbon footprint modeling during the design approval phase so buyers can make informed trade-offs between aesthetic features and emissions impact.
Practical Guidance for Buyers #
Start lifecycle thinking at the RFQ stage, not after production. Include carbon footprint disclosure as a mandatory RFQ requirement, specifying ISO 14067 or PAS 2050 methodology. Most converters cannot provide this data initially, but making it a consistent requirement signals that you will prioritize suppliers who invest in measurement infrastructure. In our experience qualifying packaging suppliers across Southeast Asia and China, fewer than 15% could produce credible LCA documentation without 60+ days of lead time.
Challenge material specifications that originate from legacy designs. Tea packaging formats often carry forward specifications from decades-old designs when barrier films were the only reliable option for moisture control. Ask: “What barrier performance do we actually need for a 90-day shelf life in a climate-controlled retail environment?” and “Can we achieve that with a mono-material solution?” Nine times out of ten, the answer is yes, but it requires testing to overcome internal risk aversion.
Request design-for-disassembly documentation during sampling. Specifically: Can the package be separated into single-material streams by a consumer in under 15 seconds without tools? If not, it will not be recycled at any meaningful rate, regardless of material recyclability claims. Test this yourself with samples before approving production — if your procurement team cannot disassemble it easily, neither will end consumers.
Verify that “recyclable” claims match local infrastructure reality. A package may be technically recyclable under laboratory conditions but functionally non-recyclable if local MRFs do not accept that material format. For export markets, request documentation showing that the package format is accepted in the destination country’s recycling system. NFPA 855 Standard for the Installation of Stationary Energy Storage Systems is relevant for industrial packaging but tea brands should reference region-specific recycling standards such as the EU’s Packaging and Packaging Waste Directive or the US’s How2Recycle labeling system.
Prioritize transport weight optimization over substrate cost. A 15% increase in substrate cost that reduces package weight by 40% delivers net cost savings when transportation is included in total landed cost calculations. Most procurement systems are not set up to evaluate this automatically — you need to request full lifecycle cost modeling from suppliers, including freight impact.
Need custom tea packaging that meets specific carbon footprint targets or biodegradability requirements? Request a quote from our engineering team — we can provide ISO 14067-compliant carbon modeling and functional testing during the sampling phase. MOQ starts at 500 units for structural prototyping, with full production runs from 5,000 units.
Technical Verification Questions #
- What is the cradle-to-gate carbon footprint (kg CO₂e per functional unit) of your proposed package design, calculated according to ISO 14044 methodology, and can you provide third-party verification from an accredited LCA practitioner?
- For multi-material designs, what is the separation time required for a consumer to disassemble the package into single-material streams, and have you verified acceptance of each material component in the destination market’s municipal recycling system?
- What is the oxygen transmission rate (OTR in cc/m²/day at 23°C / 50% RH) and water vapor transmission rate (WVTR in g/m²/day) of your proposed barrier system, and can you provide 9-month accelerated shelf-life data showing equivalence to the current packaging format?
- For adhesive and coating systems, what is the VOC (volatile organic compound) content in g/L, and are all components compliant with EU REACH Annex XVII restrictions and US FDA 21 CFR 175.105 indirect food contact regulations?
- What percentage of your raw material supply is third-party certified (FSC, PEFC for fiber; ISCC, RSB for bio-based polymers), and can you provide full chain-of-custody documentation tracing material origin to final converted package?
Quality Verification Checklist #
- [ ] Carbon footprint per functional unit is ≤ 500g CO₂e for folding carton structures or ≤ 150g CO₂e for flexible pouch formats, verified by ISO 14067-compliant calculation
- [ ] Barrier performance meets minimum OTR ≤ 20 cc/m²/day for loose-leaf tea or ≤ 50 cc/m²/day for compressed tea cakes, confirmed by ASTM D3985 or ISO 15105-2 testing
- [ ] Package can be separated into recyclable single-material streams in ≤ 15 seconds without tools, verified by user testing with ≥10 subjects
- [ ] All inks and coatings have VOC content ≤ 50 g/L and are free from heavy metals per EN 71-3 migration limits (Pb, Cd, Hg, Cr(VI) each < 0.1 ppm)
- [ ] Structural design passes ISTA 3A or equivalent transit simulation (vibration, compression, drop) without product damage or package failure
- [ ] Supplier provides certified mill test reports for recycled content percentage and contaminant levels (PAH, MOSH/MOAH) in food-contact materials
- [ ] Drop-test performance maintains product integrity from ≥ 1.0m height for rigid structures or ≥ 0.6m for flexible formats, tested per ASTM D5276
Key Specifications Table #
| Parameter | Recommended Value | Verification Method |
|---|---|---|
| Production-phase carbon footprint (paperboard) | ≤ 0.40 kg CO₂e per kg substrate | ISO 14044 LCA with system boundary from forestry/pulp through substrate manufacturing; third-party verification required |
| Adhesive carbon footprint | ≤ 20g CO₂e per kg (water-based systems preferred) | Supplier environmental product declaration (EPD) per ISO 14025, or material-specific LCA data |
| Transport weight per 100g packaged product | ≤ 120g for folding carton; ≤ 35g for flexible pouch | Physical weighing of complete package assembly including all inserts and closures |
| Barrier performance (OTR for loose-leaf tea, 6-month shelf life) | ≤ 15 cc/m²/day at 23°C / 50% RH | ASTM D3985 or ISO 15105-2 oxygen permeation testing; minimum 3 samples tested |
| Ink coverage (total area, all colors) | ≤ 65% of total printable surface | Prepress file analysis measuring non-white area as percentage of total substrate |
| Recycled content (fiber-based substrates) | ≥ 80% post-consumer waste (PCW) with FSC Recycled or equivalent certification | Mill certificate of analysis with batch traceability; third-party chain-of-custody audit |
| End-of-life disposal carbon impact | ≤ 0.15 kg CO₂e per kg package (composting or controlled incineration with energy recovery) | Waste treatment scenario modeling per ISO 14044; methane capture efficiency must be documented for landfill scenarios |
Looking for a manufacturer that can meet these carbon footprint and barrier specifications while maintaining structural performance? Get technical validation samples — our engineering team provides full LCA modeling and shelf-life testing before production commitment. MOQ starts at 500 units.
Frequently Asked Questions #
Q: Is carbon footprint reduction always more expensive than conventional packaging?
No. Material reduction through structural optimization typically reduces both cost and carbon footprint — less substrate, less freight, less waste disposal. The study showed that mono-material corrugated designs reduced package cost by 18–22% versus multi-material laminates while cutting emissions by 40–55%. The upfront cost comes from design engineering time, not production. Payback period is typically under 50,000 units for structural changes, faster for material substitutions.
Q: Can bamboo sheath or other natural fiber materials meet food safety requirements for direct tea contact?
Yes, if properly sourced and processed. Bamboo sheath must be harvested at the correct maturity stage (45–60 days post-emergence), cleaned to remove surface contaminants, and dried under controlled conditions to prevent mold growth. Critical specification: total plate count ≤ 1,000 CFU/g, yeast and mold ≤ 100 CFU/g, no detectable Salmonella or E. coli. Only 2 of 9 suppliers in the study dataset could consistently meet these criteria. Request certificate of analysis for every production lot.
Q: How much can I reduce carbon footprint by switching to recycled paperboard without changing package design?
Approximately 35–42% reduction in raw material production emissions, but this assumes PCW content ≥ 80% and equivalent structural performance. Lower-grade recycled board may require 15–20% greater thickness to match virgin-kraft strength, partially offsetting the carbon benefit. Net lifecycle reduction typically lands at 28–35% when structural compensation is accounted for. Bigger gains come from design optimization, not just material substitution.
Q: Do consumers actually care about packaging carbon footprint, or is this just for corporate sustainability reporting?
Consumer research in the study showed that 67% of premium tea buyers (defined as purchasing ≥ $15 per 100g) consider packaging sustainability “important” or “very important,” but only 18% could correctly identify which package formats had lower environmental impact when shown side-by-side options. Education matters more than labeling. Transparency about carbon footprint builds trust with B2B buyers and retail partners more effectively than it influences end-consumer point-of-sale decisions.
Q: What is the most common mistake packaging buyers make when trying to reduce carbon footprint?
Focusing exclusively on recycled content percentage while ignoring design efficiency, transport weight, and end-of-life infrastructure. A package made from 100% recycled material that is 40% heavier than necessary and non-recyclable in the destination market will have a worse lifecycle footprint than a lighter-weight virgin-material package that actually gets recycled. System-level thinking beats material-level optimization every time.
Published by ukugi.com Technical Team | Request lifecycle carbon modeling for your tea packaging project
Data source: Life Cycle Carbon Assessment of Tea Packaging Systems Using Multi-Material Optimization, H. Zhang et al., Journal of Cleaner Production, 2024


