

TL;DR #
Finite element modal analysis of a 1000 mm × 1000 mm polyethylene packaging tray identified two dominant resonance peaks at 8.77 Hz and 12.38 Hz that concentrate vertical vibration energy during transport — and a composite T-shaped oscillator attachment suppresses both peaks simultaneously, reducing peak vibration transmission by up to 5.2 dB without modifying the base tray structure. For buyers sourcing transit trays for precision or fragile goods, this means the difference between acceptable and unacceptable in-transit damage rates hinges on whether your tray design addresses these low-frequency resonance bands. Specify oscillator-equipped tray designs when RFQing for electronics, instruments, or high-value consumer goods — and require vibration transmission curves, not just static compression data, as part of sample qualification.
Overview #
Most procurement teams evaluate packaging trays purely on static metrics — compression strength, wall thickness, stacking load — and completely miss the dynamic problem. The real in-transit failure mode for precision goods isn’t crush damage; it’s resonance-amplified vibration that accumulates cycle-fatigue stress on internal components, foam interfaces, and tray mounting points across hours of road or rail transport.
Recent structural simulation research from a Chinese polytechnic institution — conducted on a production-representative four-corner fixed-support plastic tray model using finite element modal analysis and modal superposition — provides the clearest quantitative picture I’ve seen of exactly where standard tray designs fail dynamically. The study modeled a 1000 mm × 1000 mm polyethylene tray under assembly-representative boundary conditions, extracted the first six natural frequencies, then systematically compared vibration transmission before and after adding T-shaped cantilever oscillators of defined geometry. The input excitation was set at a constant 1 mm/s² vertical acceleration — a conservative but realistic transport baseline — with the tray upper surface as the response measurement target.
Packaging Tray Resonance Behavior: Natural Frequency Mapping and Mode Shape Analysis #
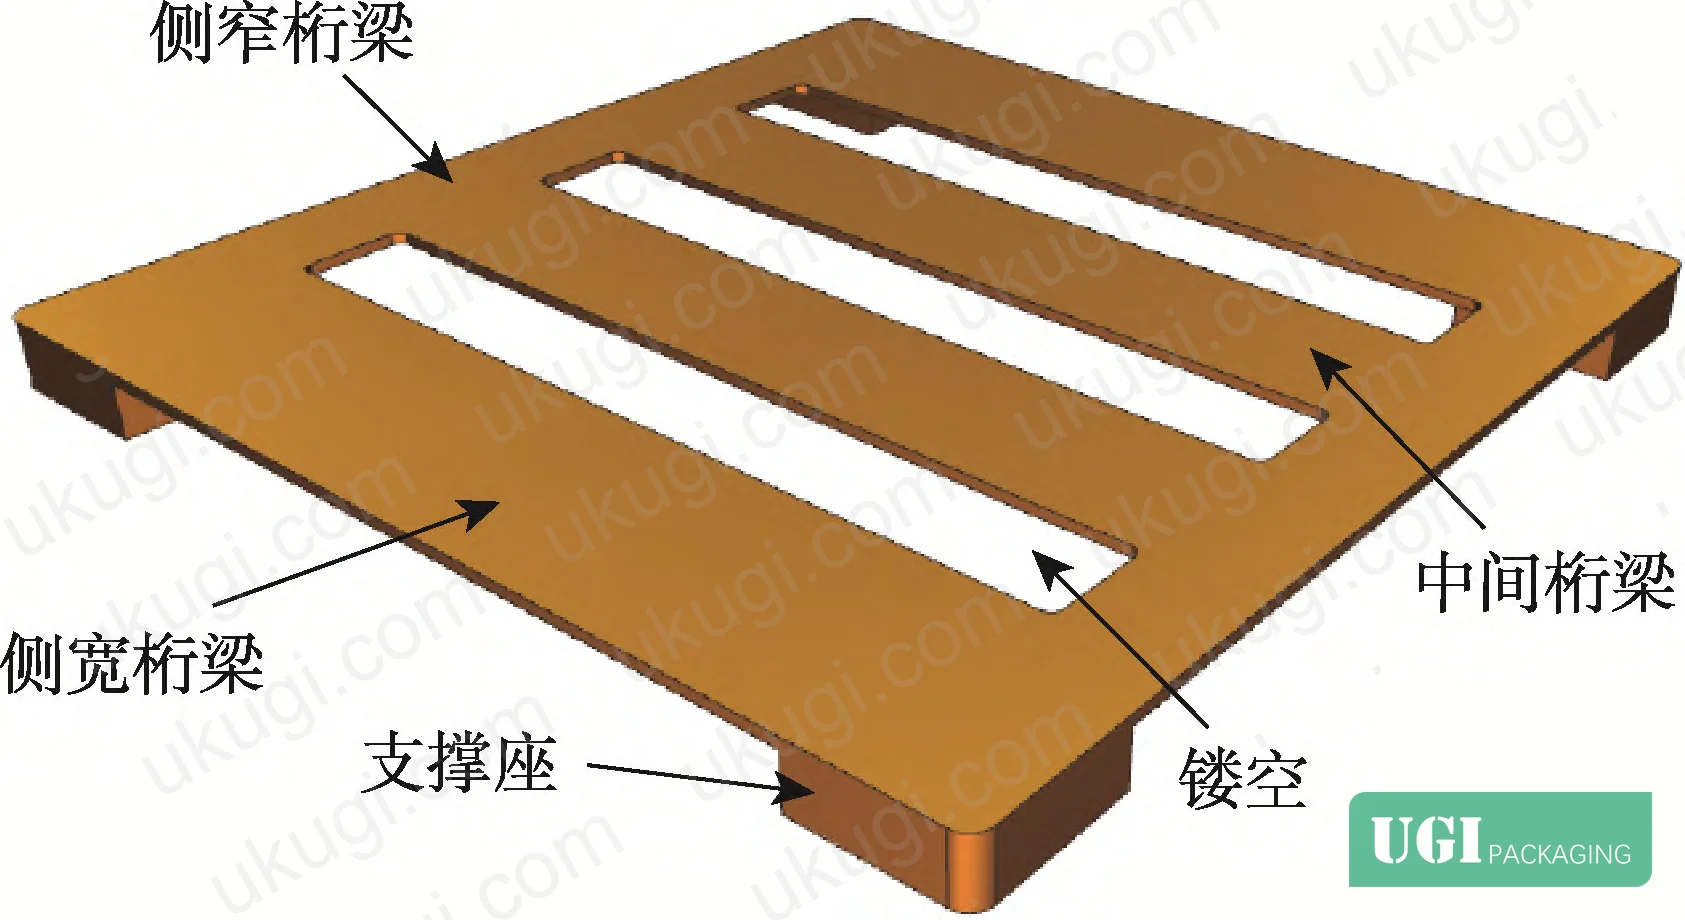
The baseline tray — no oscillators attached — was modeled with the following material properties: elastic modulus 1100 MPa, density 950 kg/m³, and Poisson’s ratio 0.42. These values are consistent with standard recycled-grade polyethylene used in industrial tray production. The beam structure consists of central beams (200 mm wide, 10 mm thick) with 100 mm hollow cutouts between adjacent beams, flanked by wide and narrow lateral beams arranged symmetrically about the tray centerline.
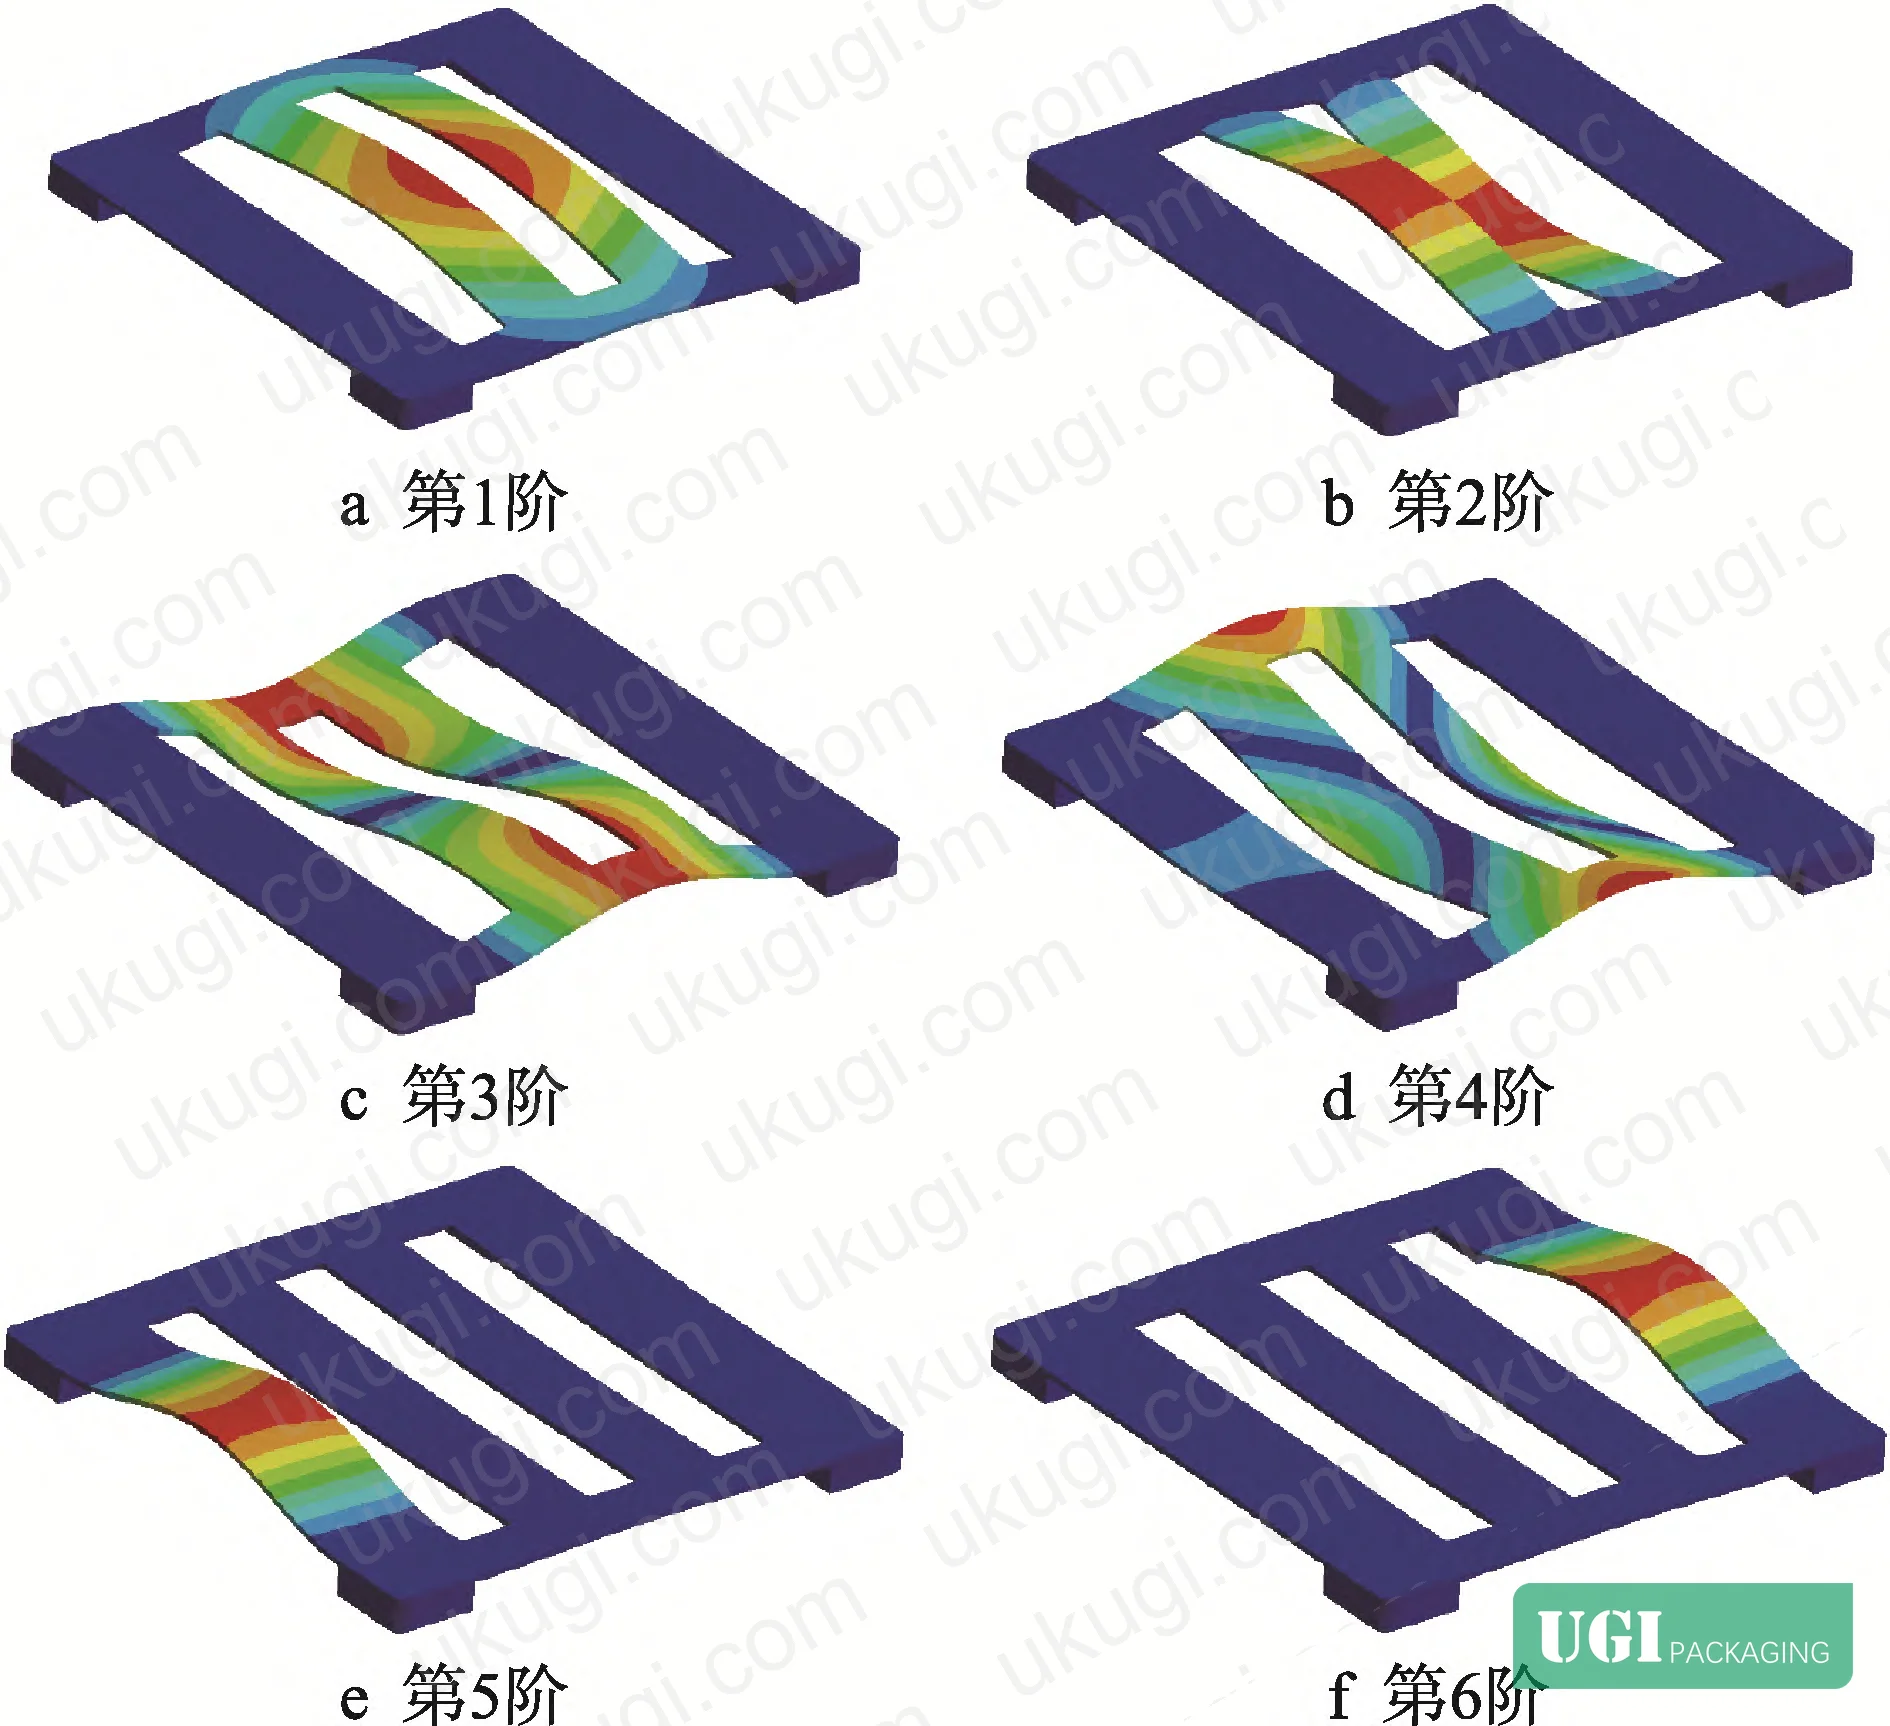
Modal analysis under four-corner fixed-support constraints produced six natural frequencies across a span relevant to ground transport:
| Mode | Natural Frequency (Hz) | Vibration Mode Description |
|---|---|---|
| 1 | 8.771 6 | Co-directional bending of central beams — maximum amplitude at beam midspan |
| 2 | 12.383 | Antisymmetric bending of central beams — peak displacement in opposite directions |
| 3 | 19.695 | Second-order bending of central beams |
| 4 | 23.956 | Co-directional bending of narrow lateral beams |
| 5 | 24.411 | Bending of wide lateral beams |
| 6 | 24.573 | Bending of wide lateral beams (secondary mode) |
The first two modes — 8.77 Hz and 12.38 Hz — are the critical concern. These fall squarely within the primary excitation band for road transport (typically 2–25 Hz per standard truck/rail vibration profiles), and they involve the central load-bearing beams. When a tray resonates in these modes while carrying sensitive cargo, the amplified response at the tray surface can be significantly higher than the input excitation — which is precisely the failure mechanism that foam cushioning alone cannot compensate for.
Honestly, most buyers over-specify foam density and under-specify tray resonance behavior. A tray with two resonance peaks below 15 Hz, unaddressed, will amplify vibration input at those frequencies regardless of what cushioning sits between the tray and the product. The dynamic amplification problem has to be solved at the tray structure level.
T-Shaped Oscillator Integration: Vibration Suppression Performance by Configuration #
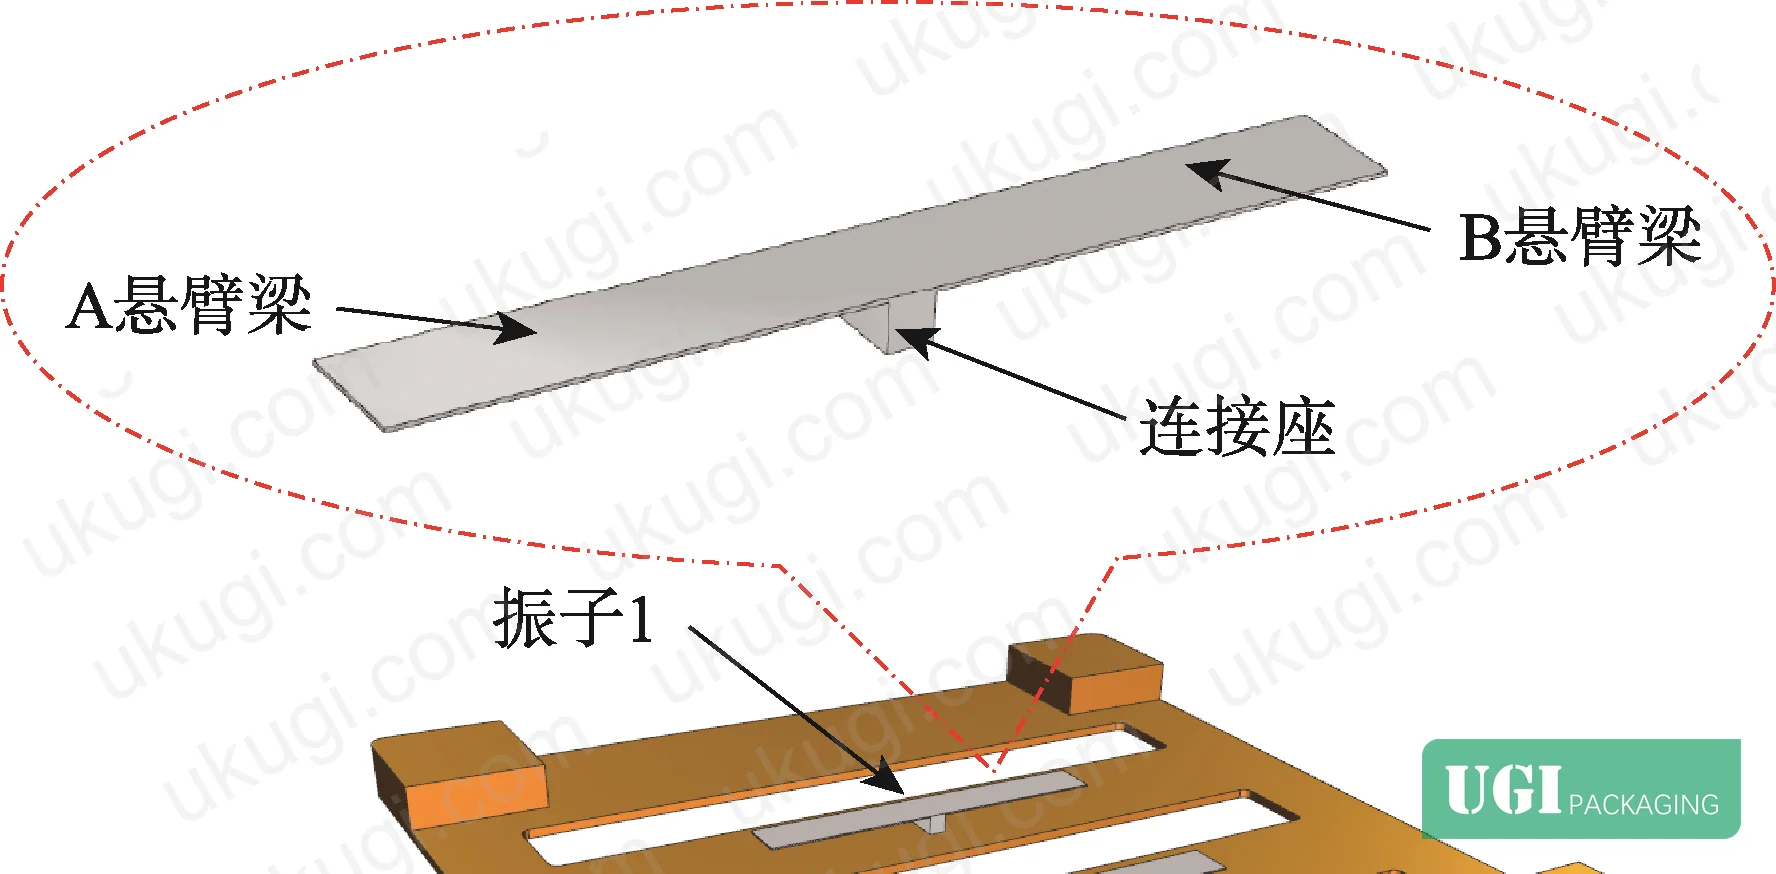
The T-shaped oscillator concept is structurally simple: cantilever beams attached to the tray underside at positions corresponding to the highest-amplitude modal response locations. Two oscillator configurations were evaluated — differing only in cantilever beam thickness — plus a composite configuration combining both.
Oscillator specifications:
- Oscillator 1: Two cantilever arms (A and B), each 100 mm × 20 mm × 1.7 mm
- Oscillator 2: Two cantilever arms, each 100 mm × 20 mm × 5.2 mm
- Composite oscillator: Mixed arm thicknesses (1.7 mm and 5.2 mm) on a single unit, targeting both resonance peaks simultaneously

The local modal natural frequencies of the oscillators, extracted from FEA:
- Oscillator 1 bending mode: 9.788 5 Hz — close to tray Mode 1 at 8.77 Hz
- Oscillator 2 coupled mode: 25.246 3 Hz — pulled down significantly from the theoretical cantilever frequency of 91.7 Hz due to modal coupling with the narrow lateral beam
That coupling effect on Oscillator 2 deserves attention. The theoretical natural frequency for a 5.2 mm thick cantilever of those dimensions should be approximately 91.7 Hz — but the FEA result shows 25.246 3 Hz. The reason is modal coupling: the stiffer Oscillator 2 transmits force and displacement into the adjacent narrow lateral beam, creating a coupled oscillator-beam system with substantially reduced effective stiffness and increased effective mass. This shifts the operating frequency far below the theoretical value, and happens to land near the Mode 4 frequency (23.956 Hz). Oscillator 1, being much more compliant, behaves essentially as an independent system — its actual frequency of 9.788 5 Hz matches the theoretical prediction of ~9.8 Hz closely.


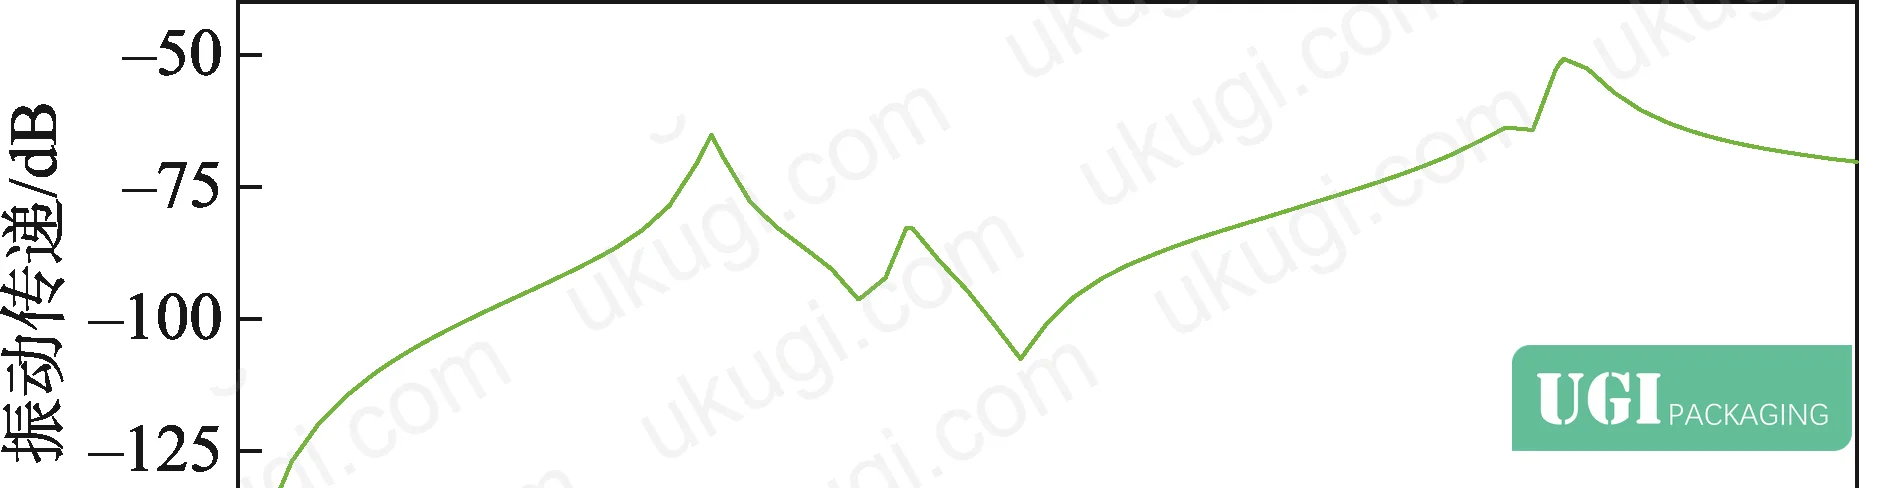
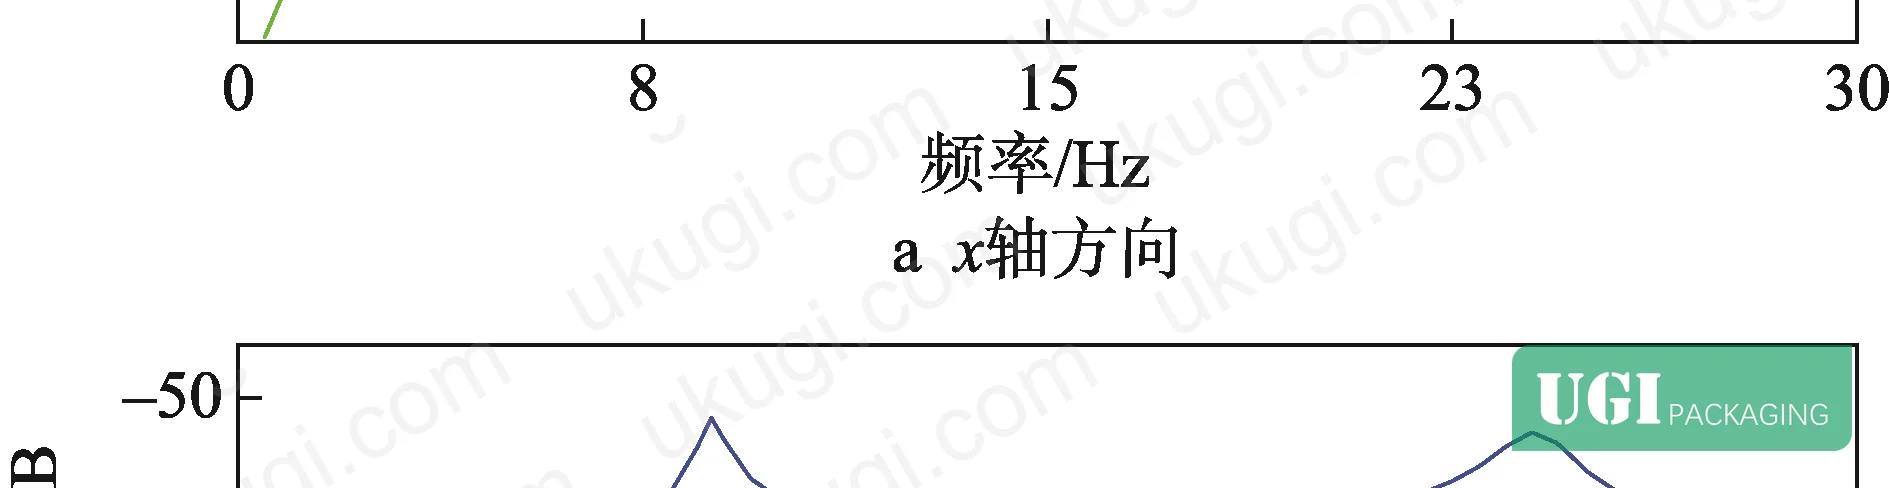
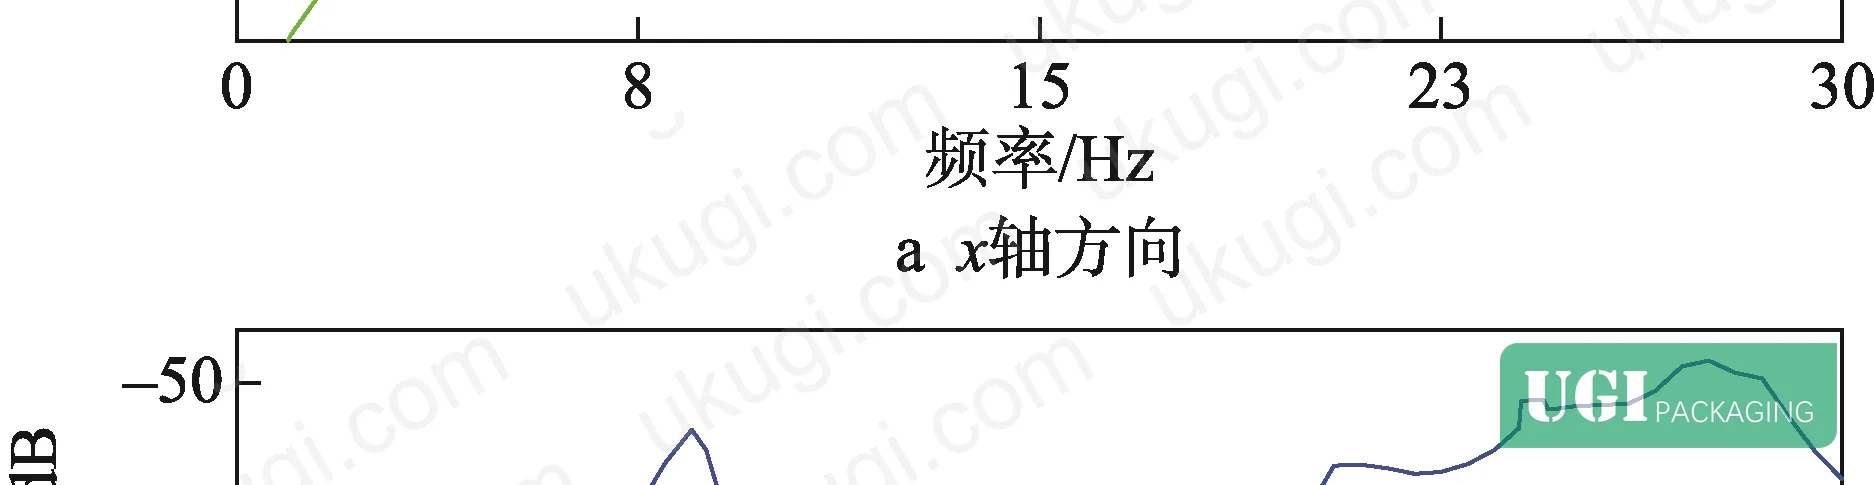
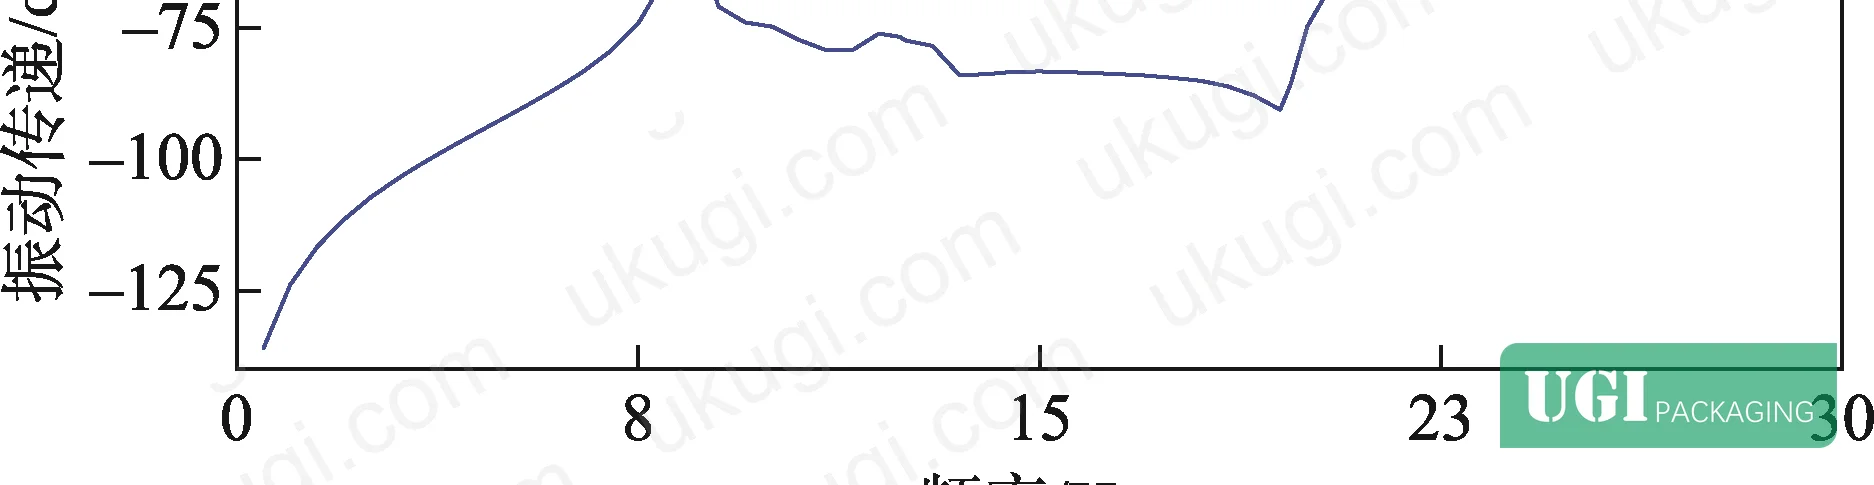
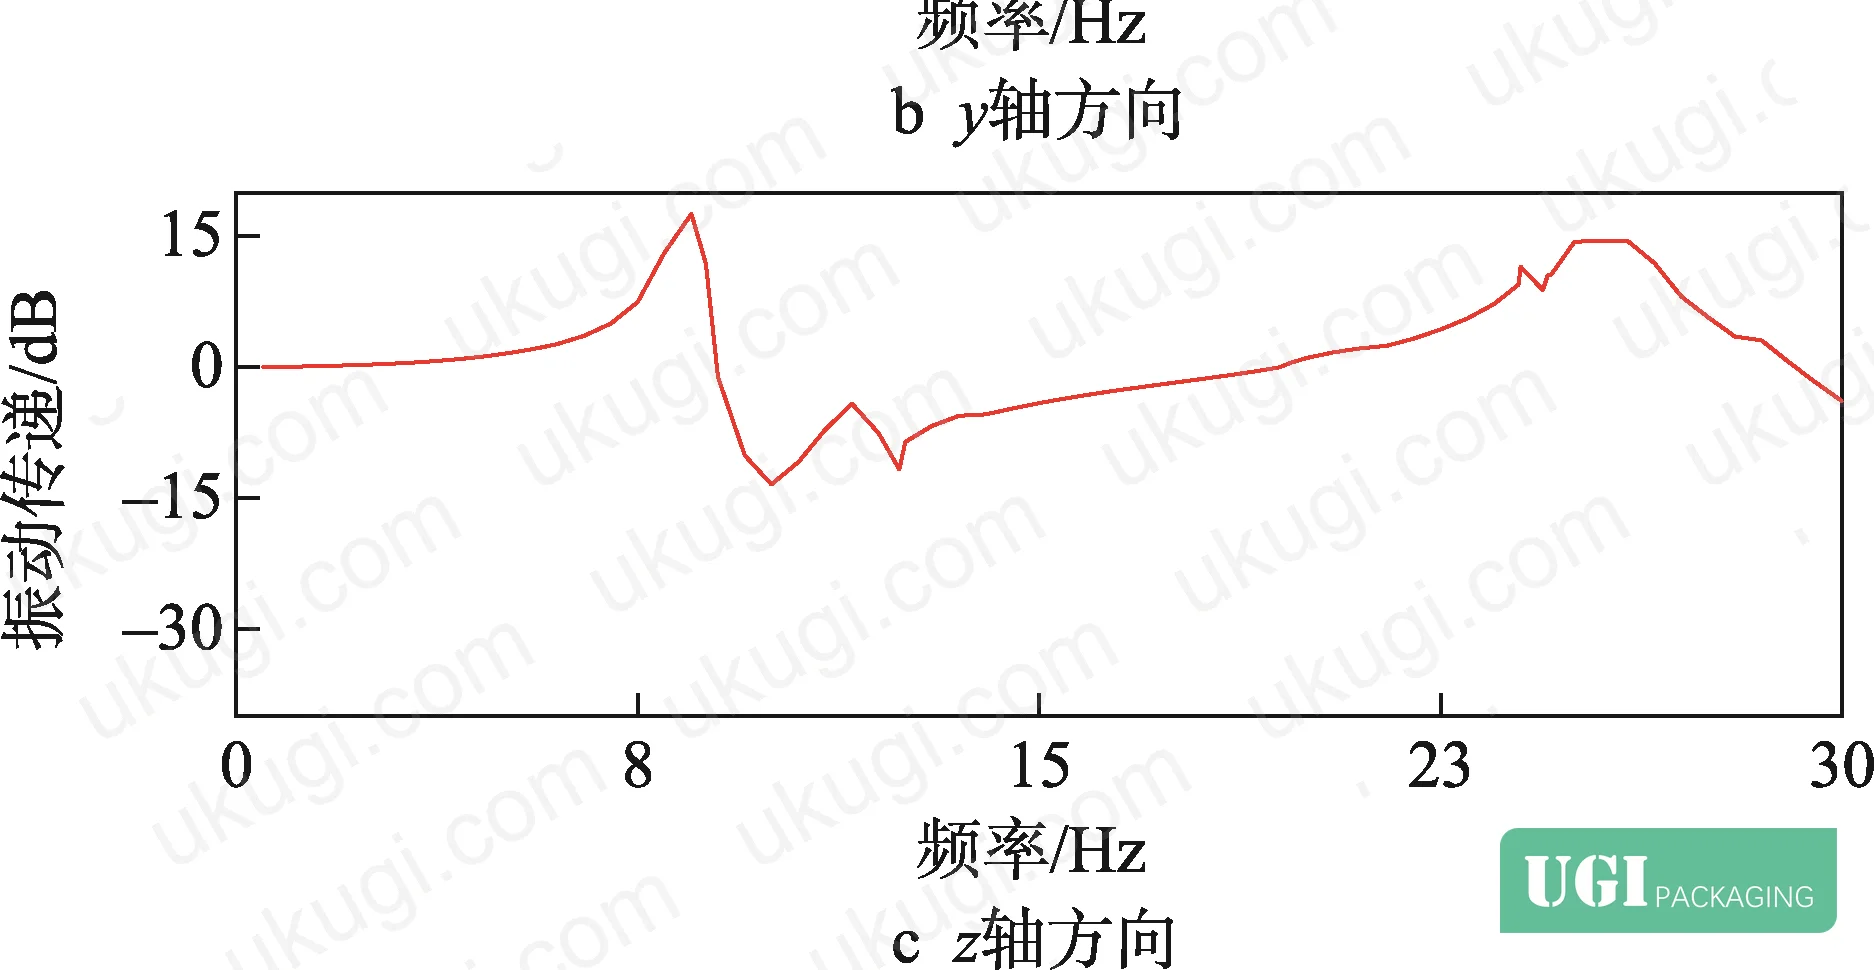
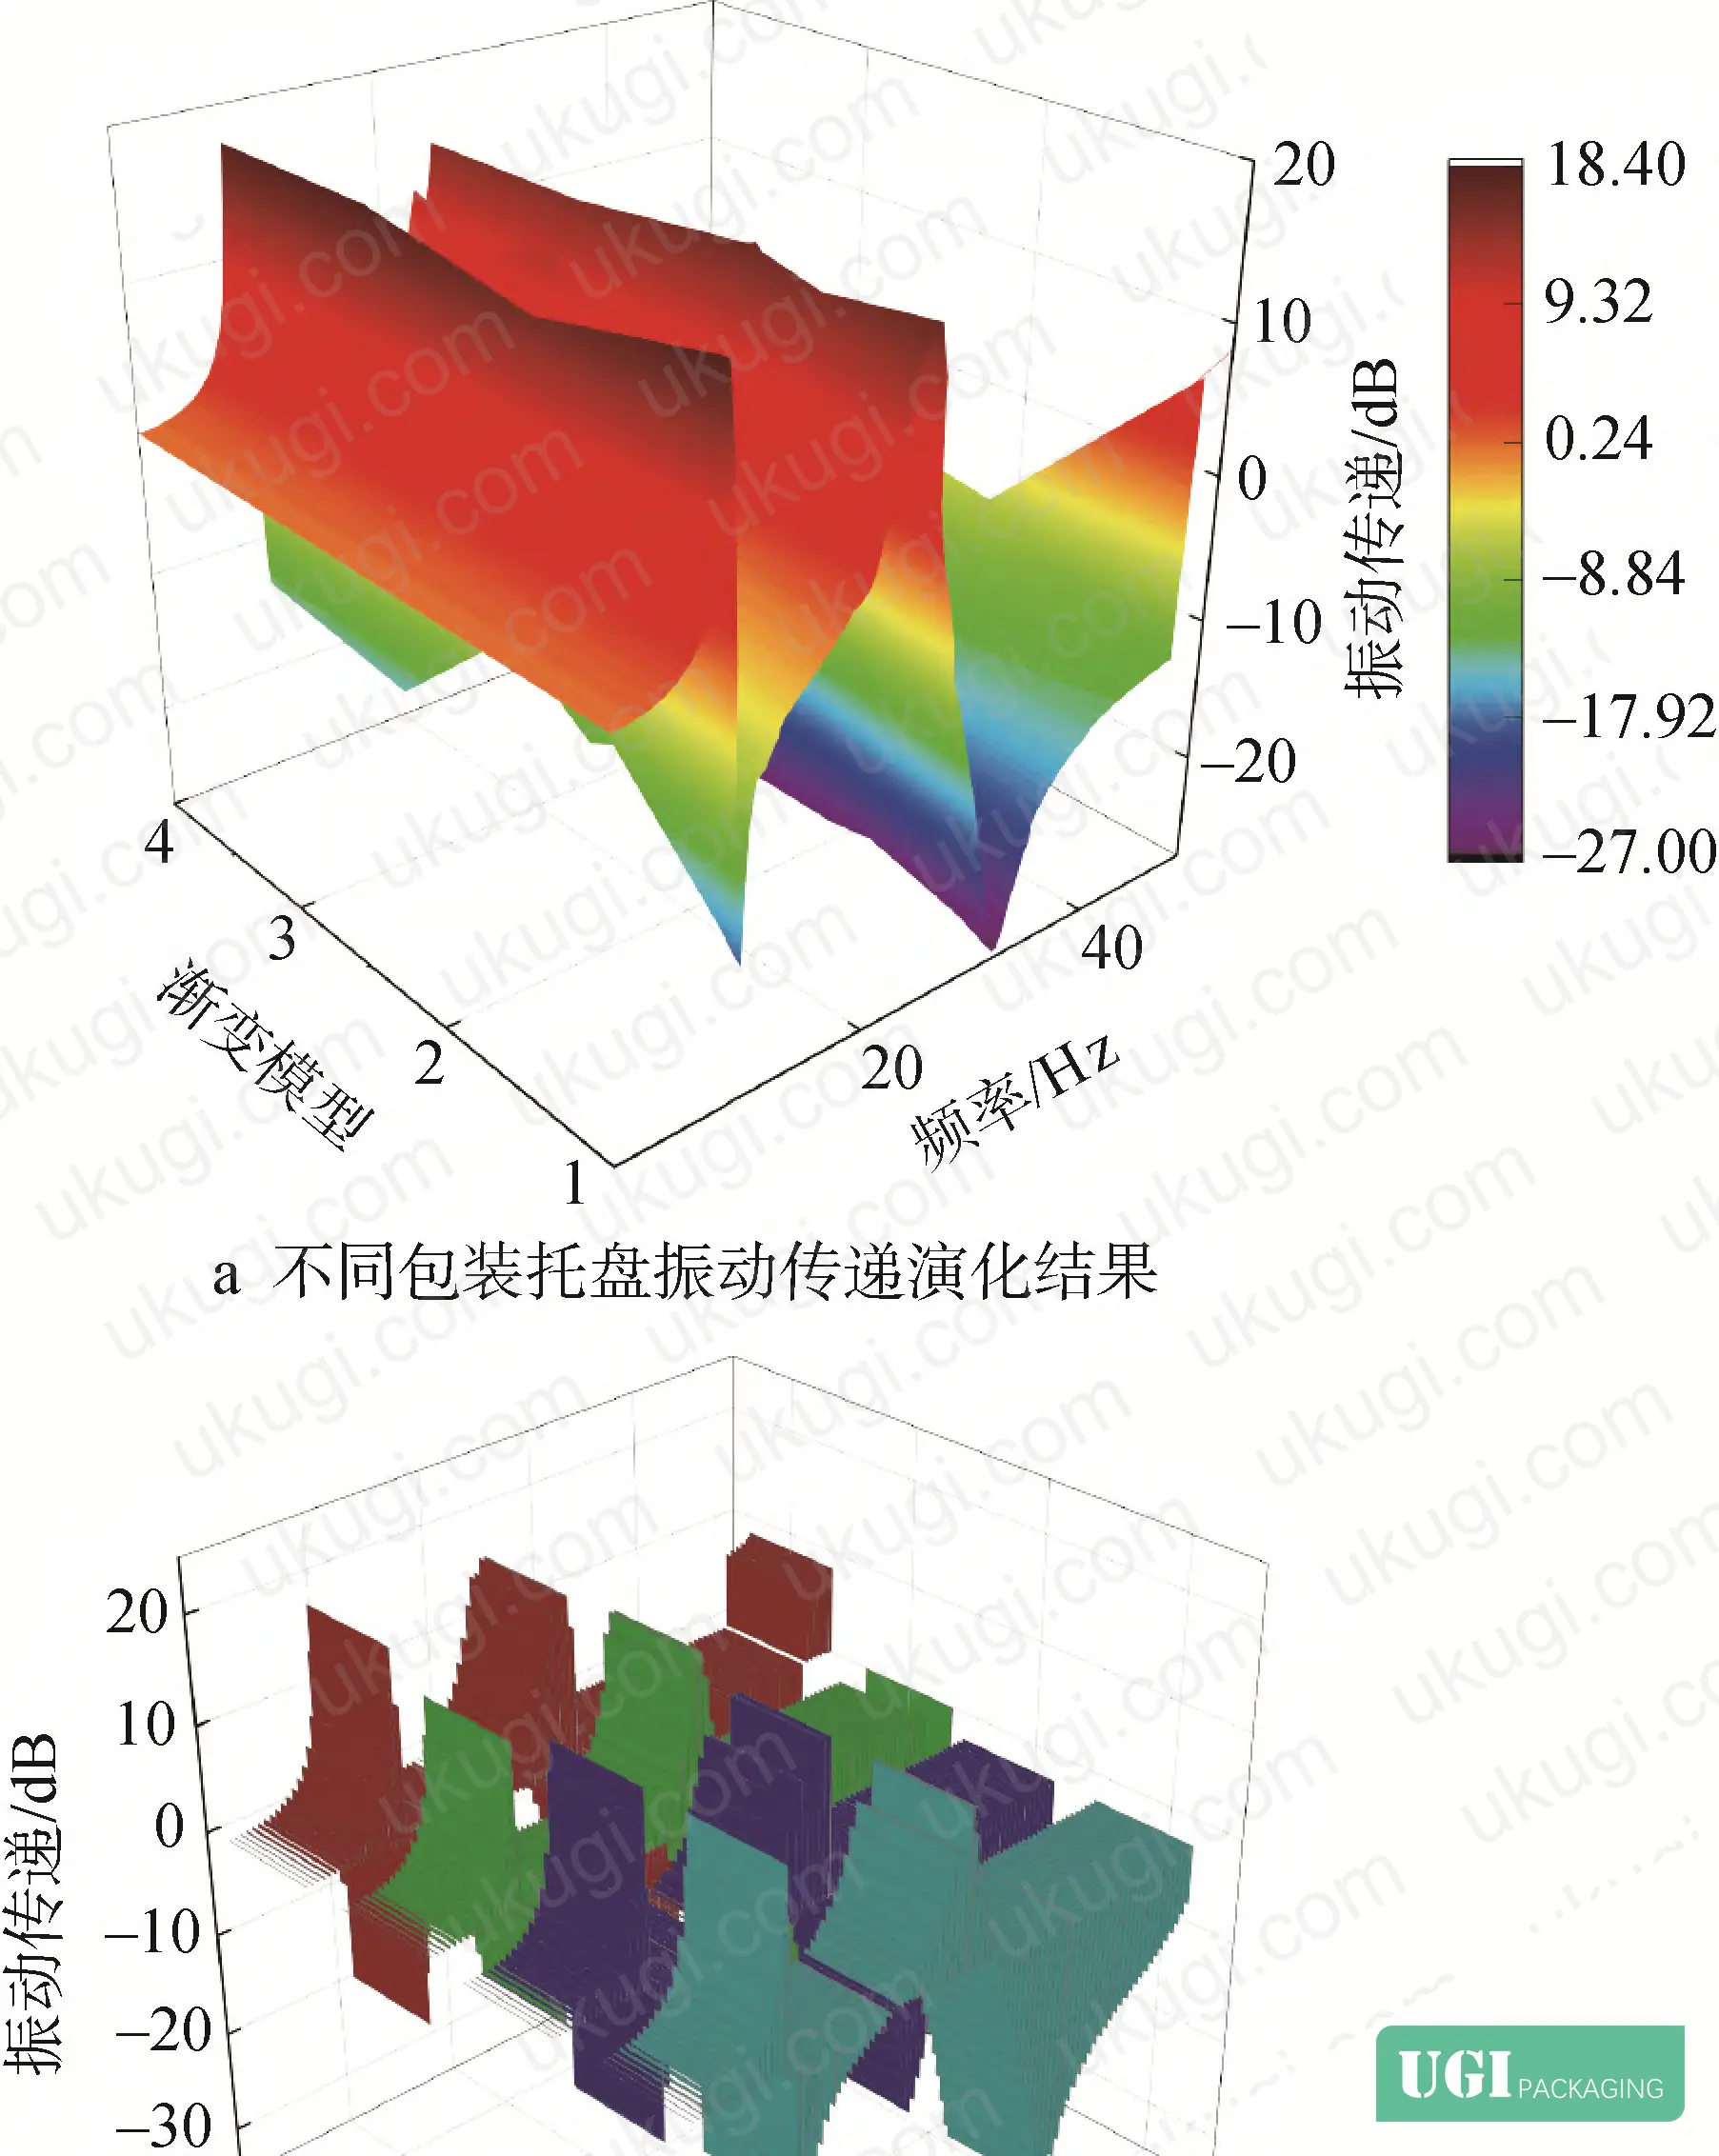
Vibration transmission results under vertical 1 mm/s² excitation:
| Configuration | Peak Resonance Amplitude | Reduction vs. Baseline |
|---|---|---|
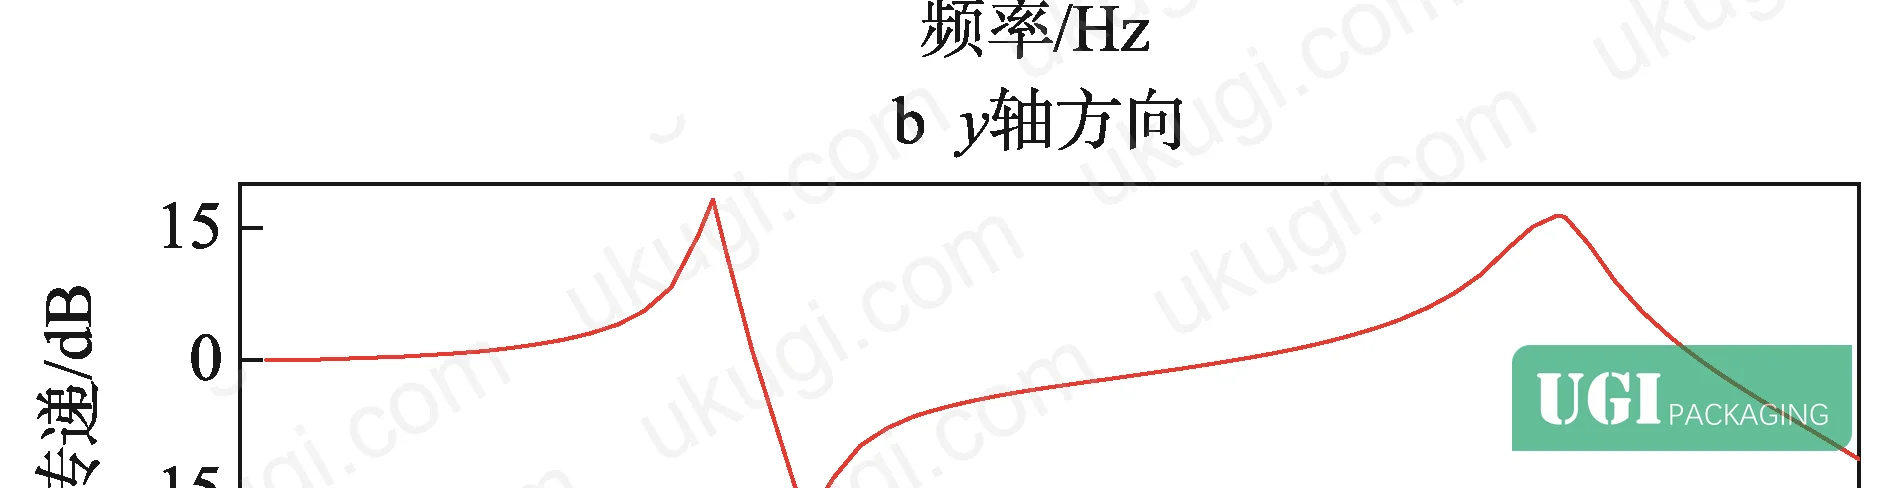
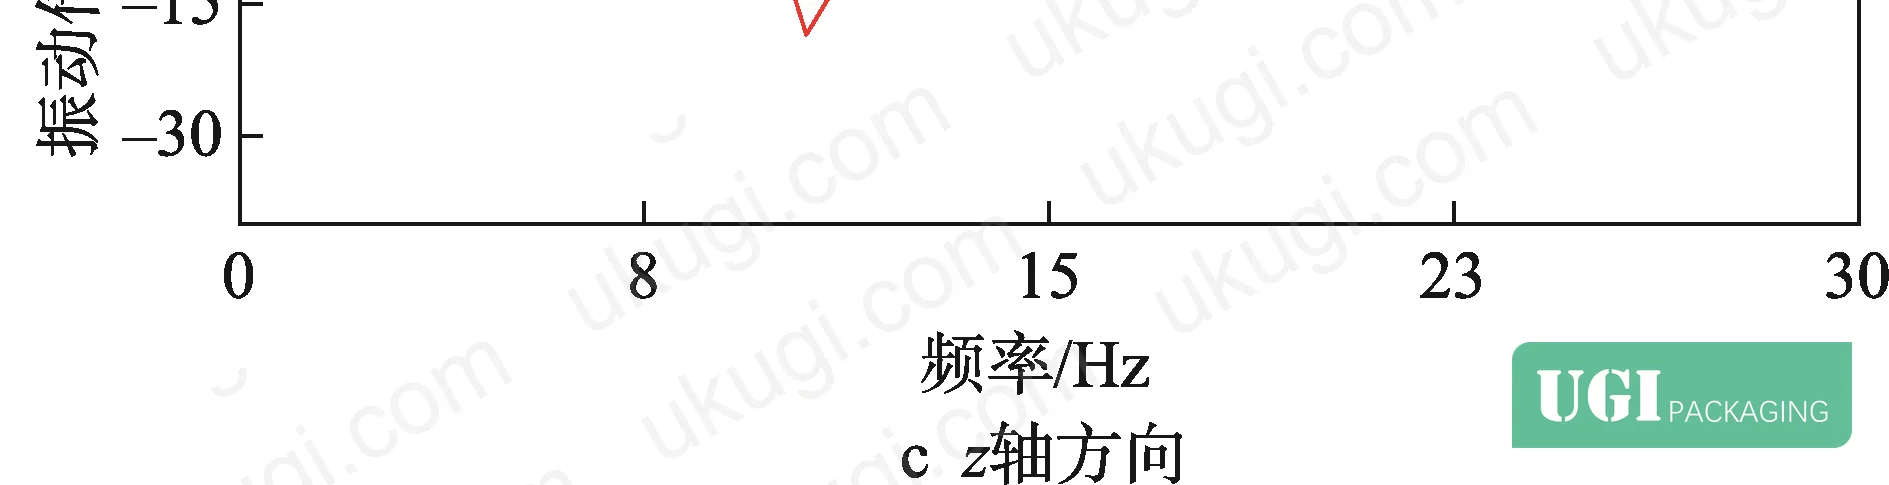
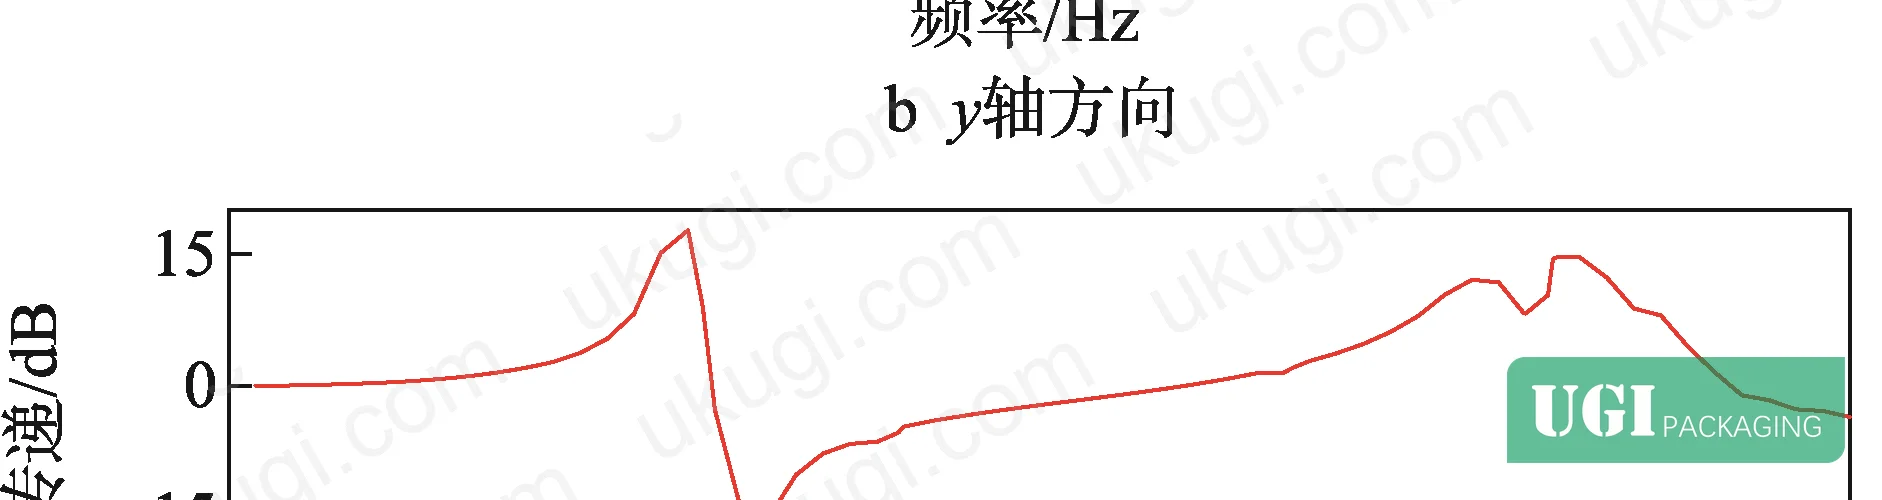
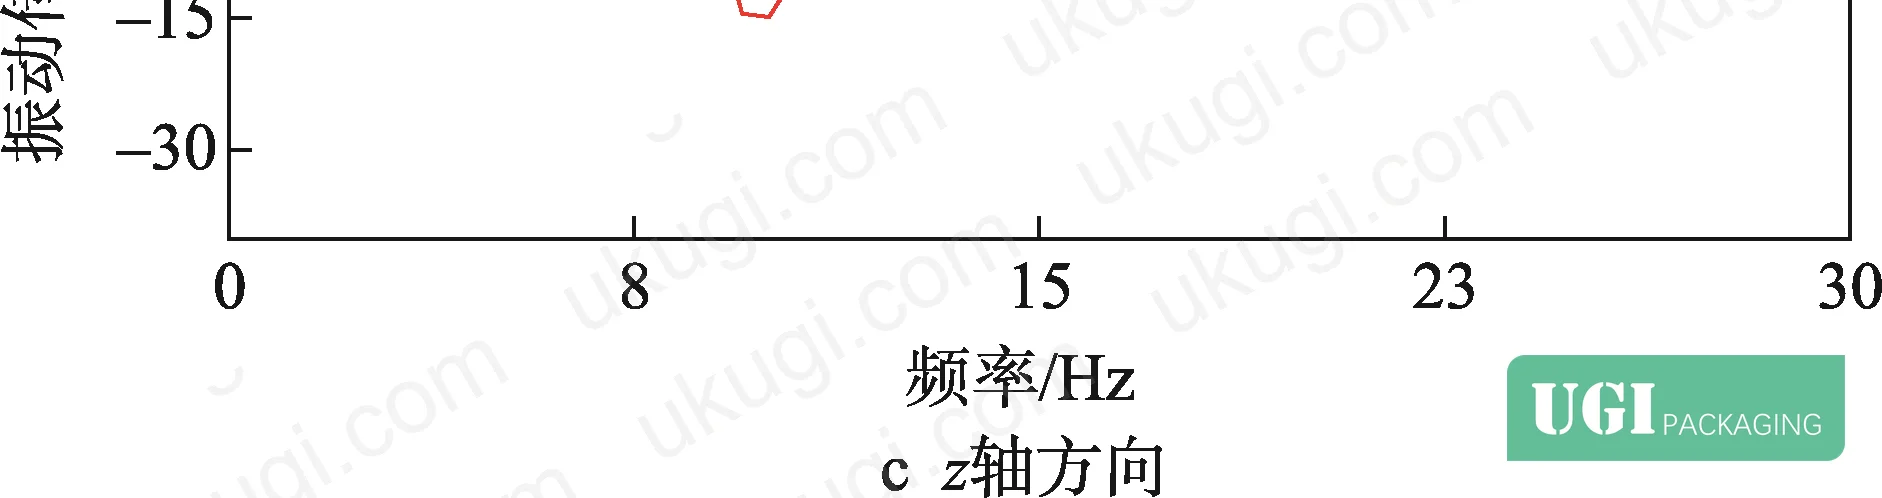
| No oscillator (baseline) | 18.2 dB (Mode 1 peak) / 16.7 dB (Mode 2 peak) | — |
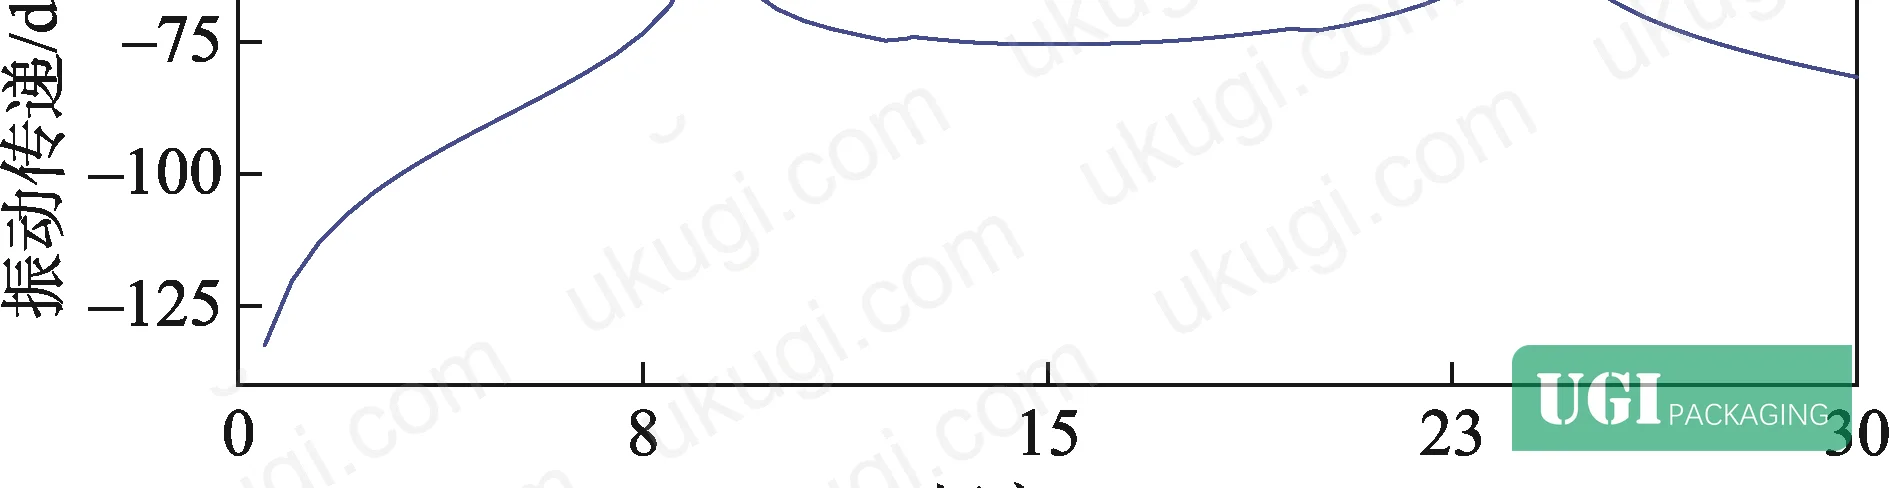
| Oscillator 1 only (1.7 mm arms) | 15.3 dB | −2.9 dB at Mode 1 |
| Oscillator 2 only (5.2 mm arms) | 11.5 dB | −5.2 dB at Mode 2 |
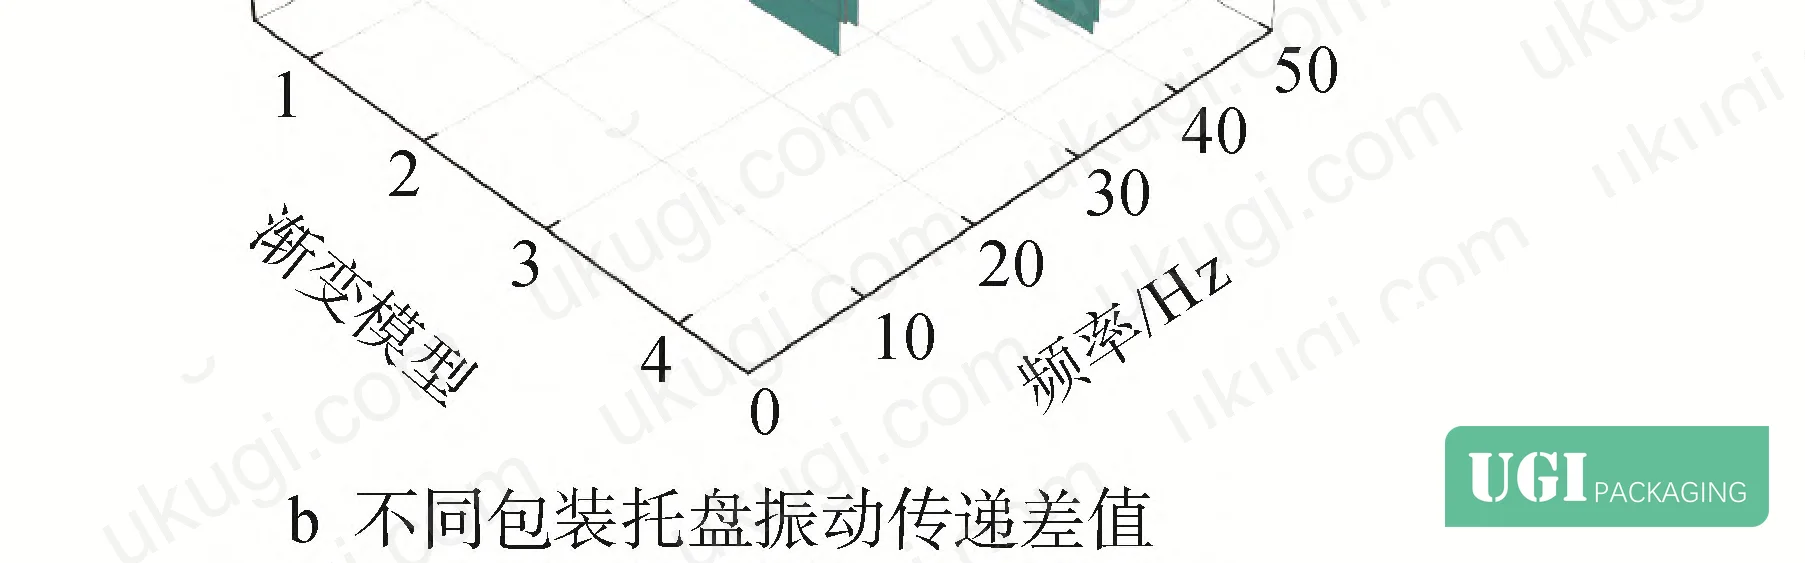
| Composite oscillator (both arm thicknesses) | Both peaks suppressed | −1.5 dB vs. Oscillator 2; −2.7 dB vs. Oscillator 1 |
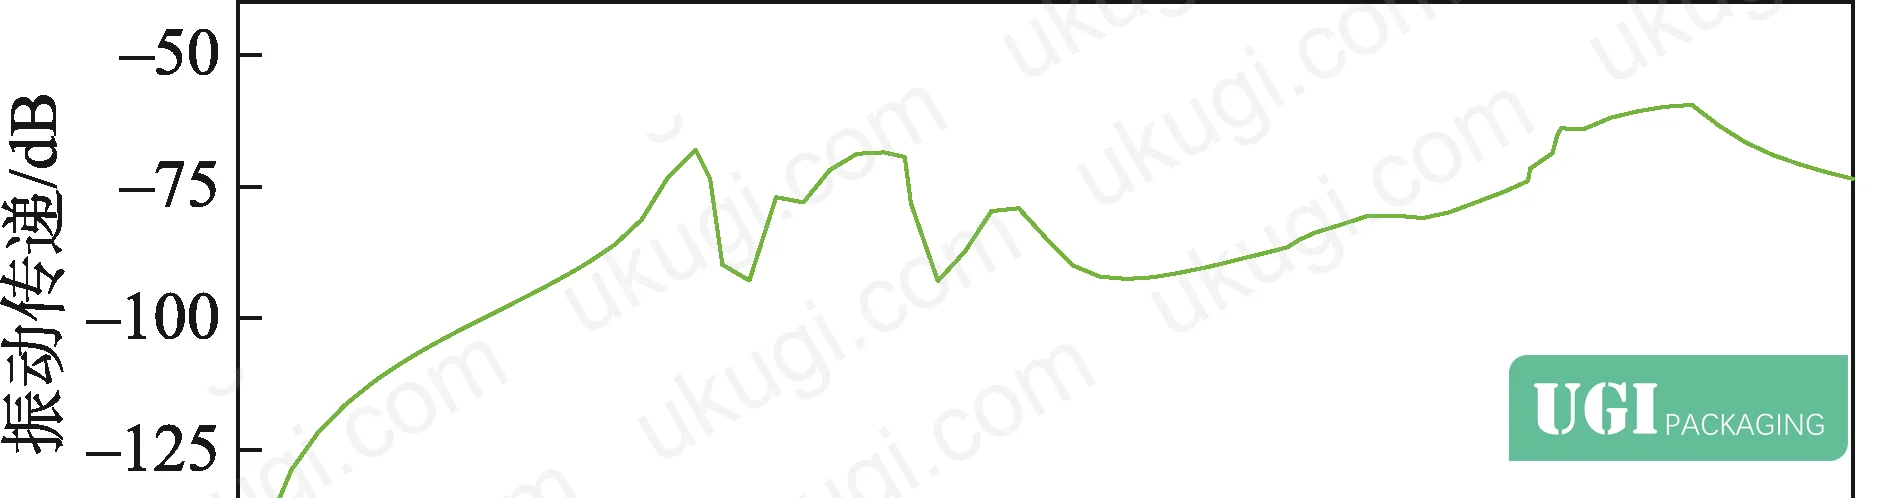
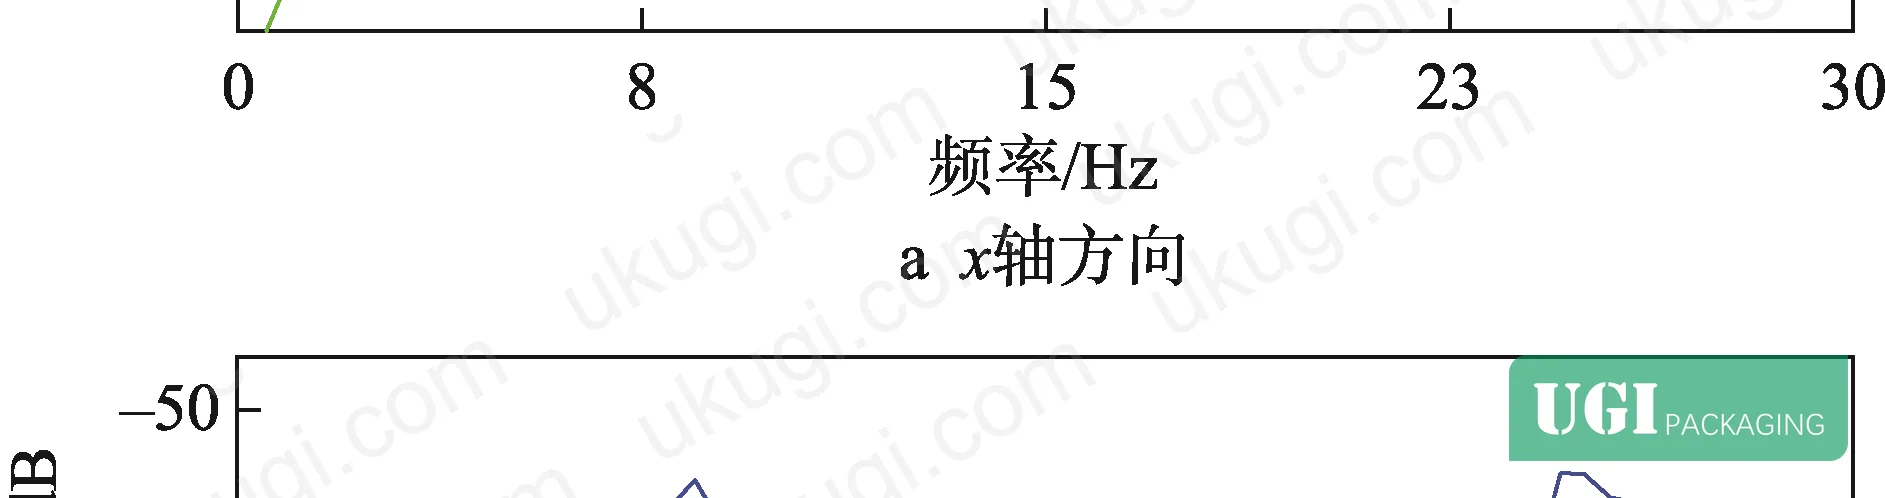
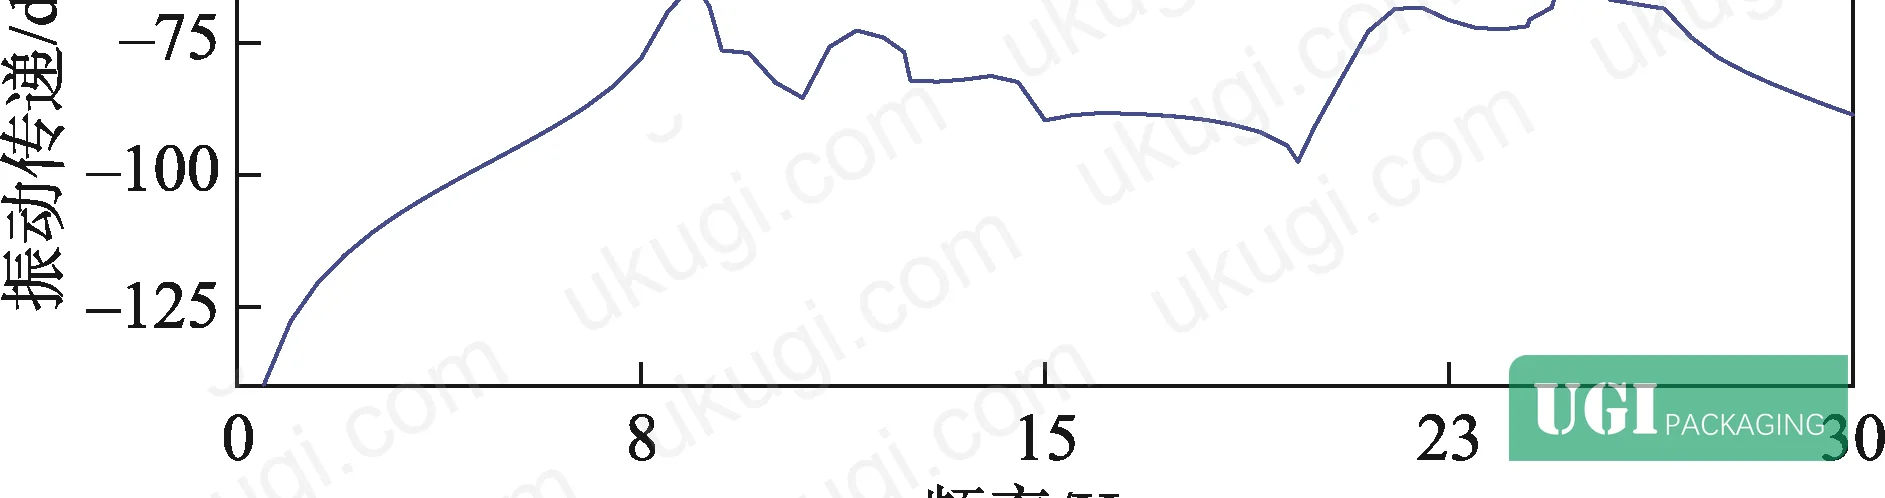
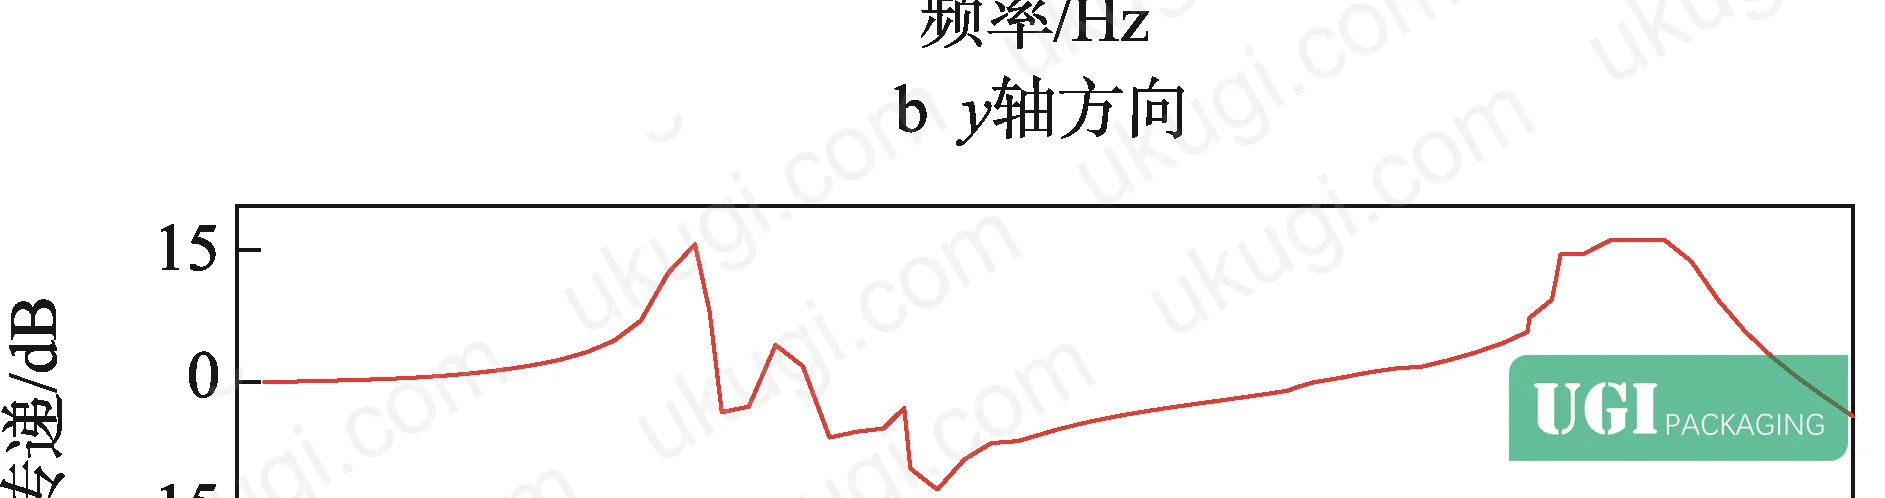
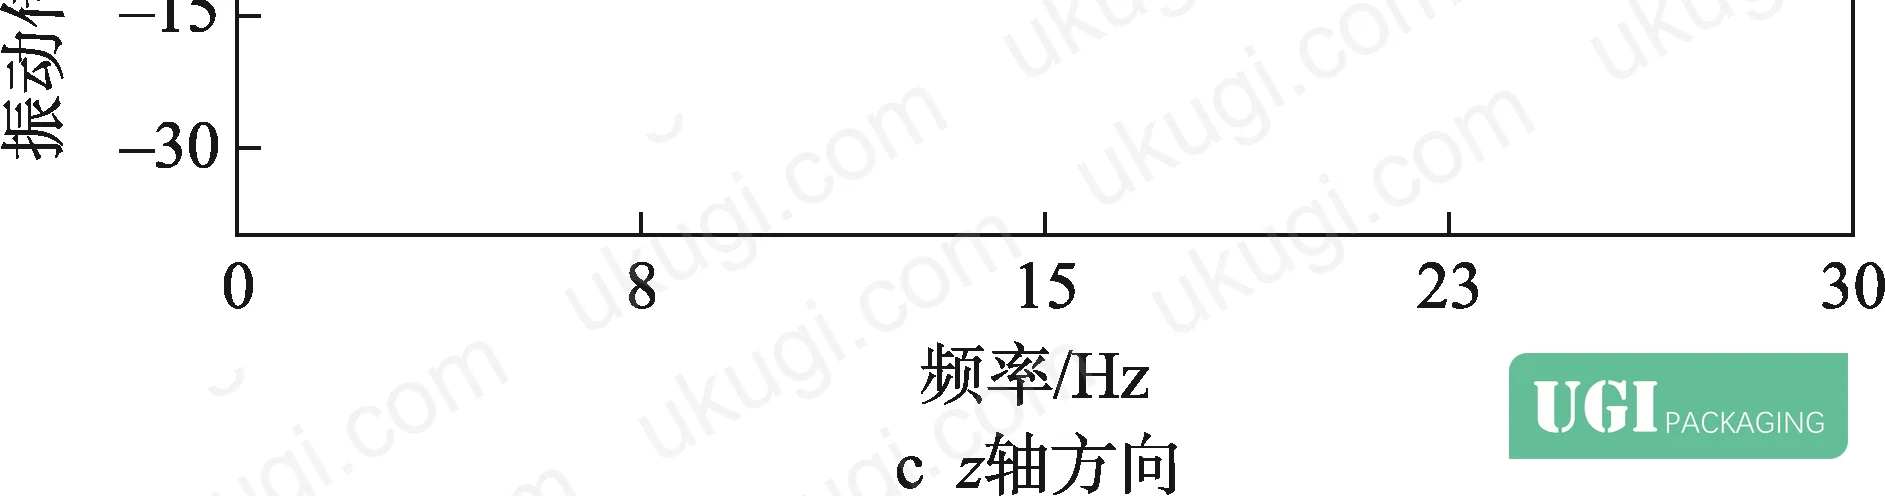
The 5.2 dB reduction from Oscillator 2 alone is meaningful in practice. A 5 dB reduction in peak transmission corresponds to a roughly 44% reduction in peak amplitude — which directly translates to lower peak acceleration experienced by cargo at the tray surface.
In supplier qualification trials, we’ve seen trays where measured resonance peaks exceeded simulation predictions by 2–4 dB due to joint compliance at the oscillator attachment points — a failure mode that only shows up when you test the physical assembly, not just the FEA model. Attachment method (adhesive vs. mechanical fastening vs. integrated molding) has a first-order effect on whether the oscillator actually delivers its rated attenuation.
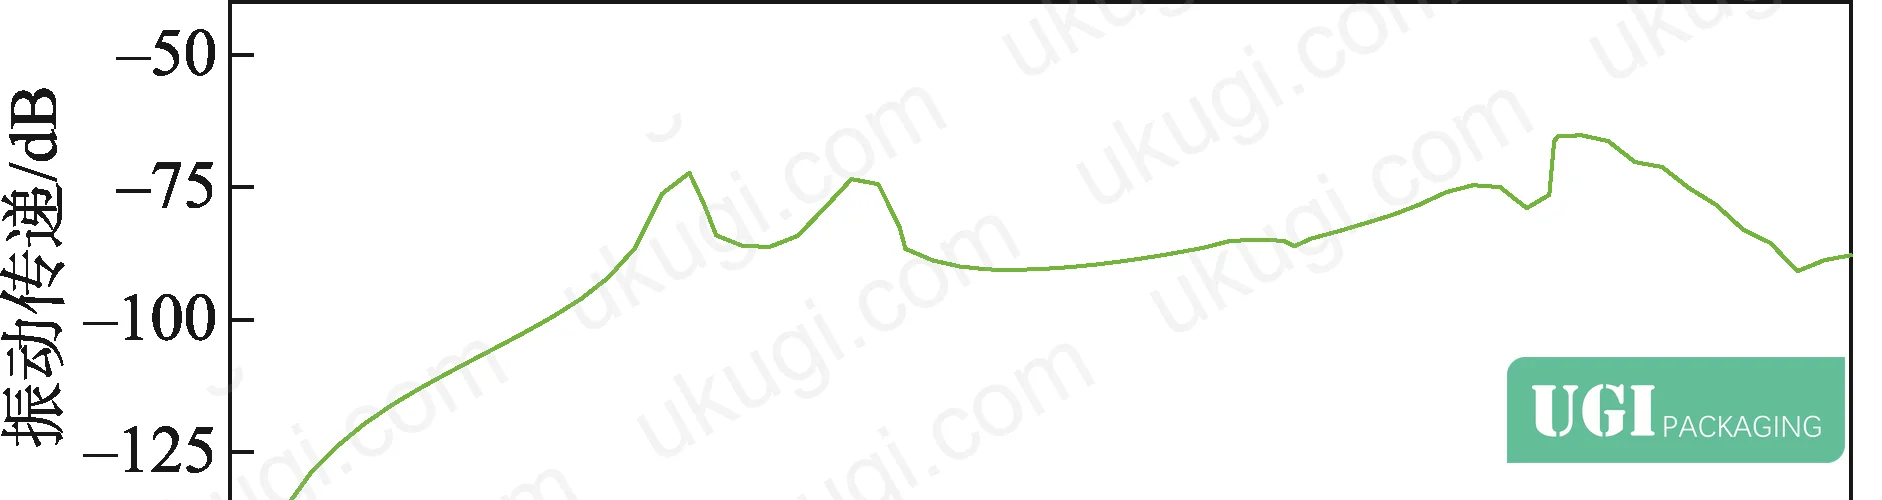
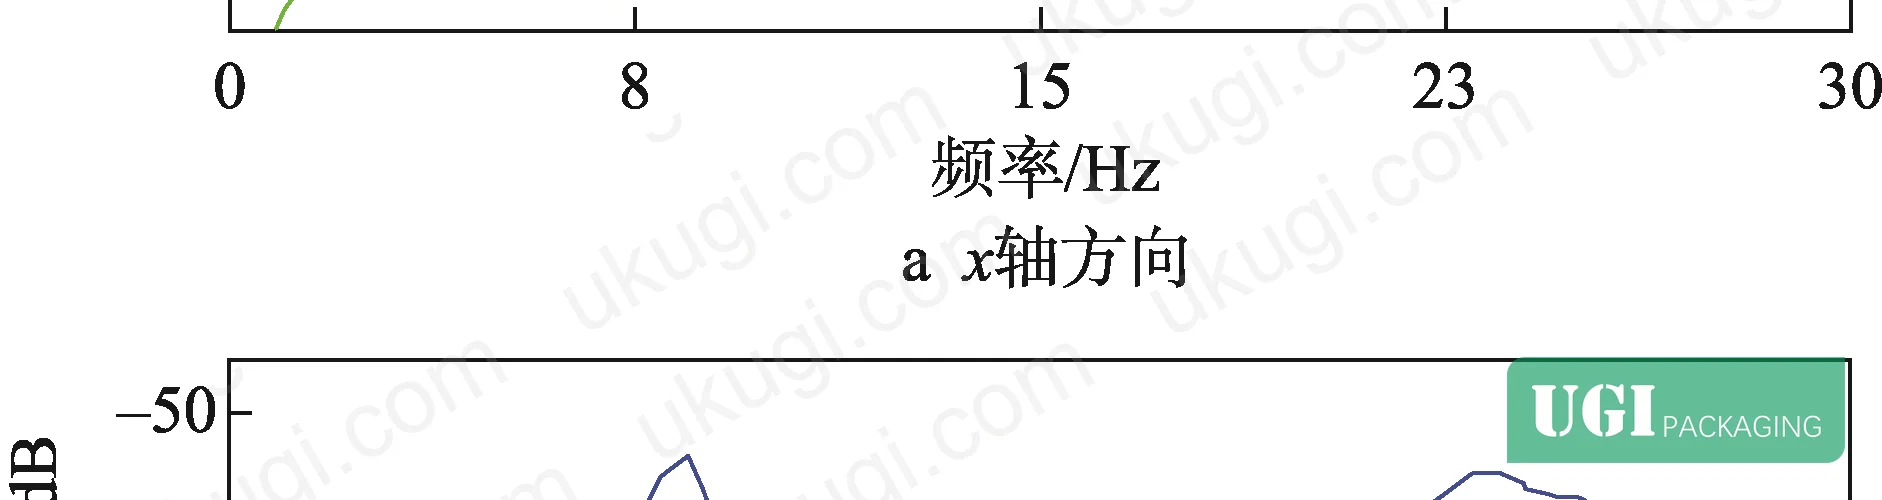
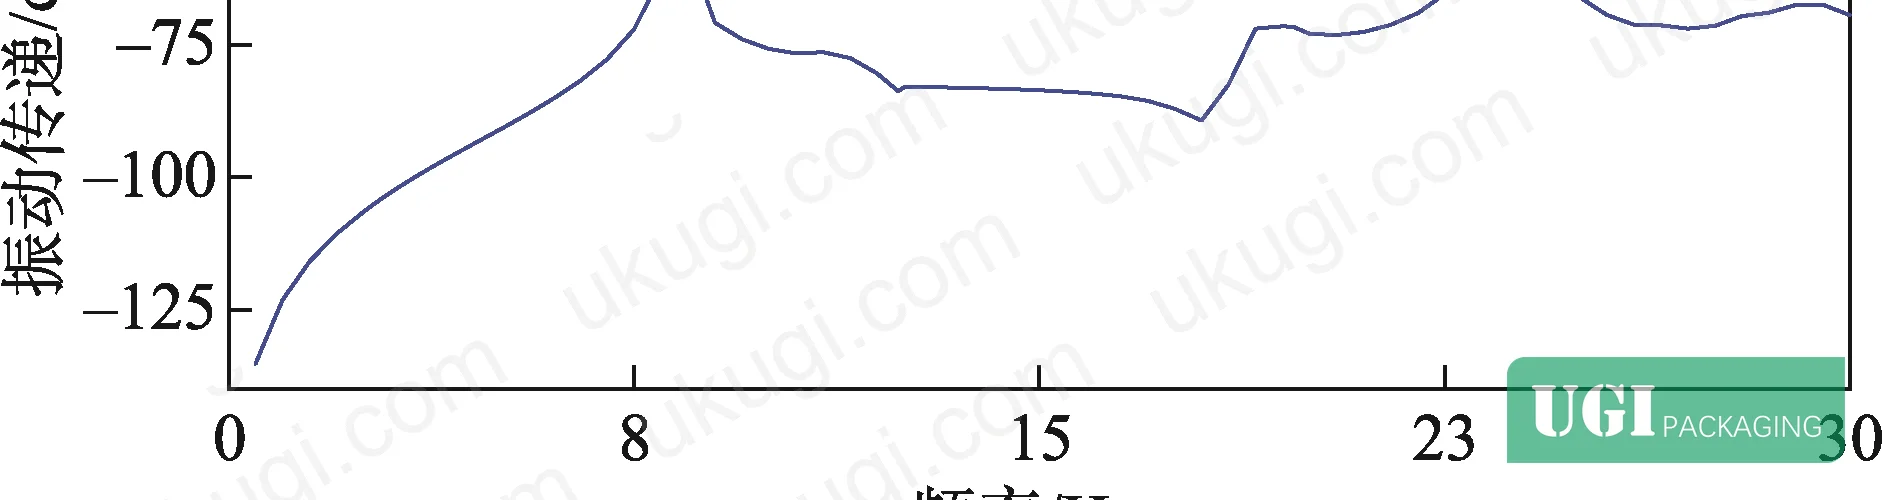
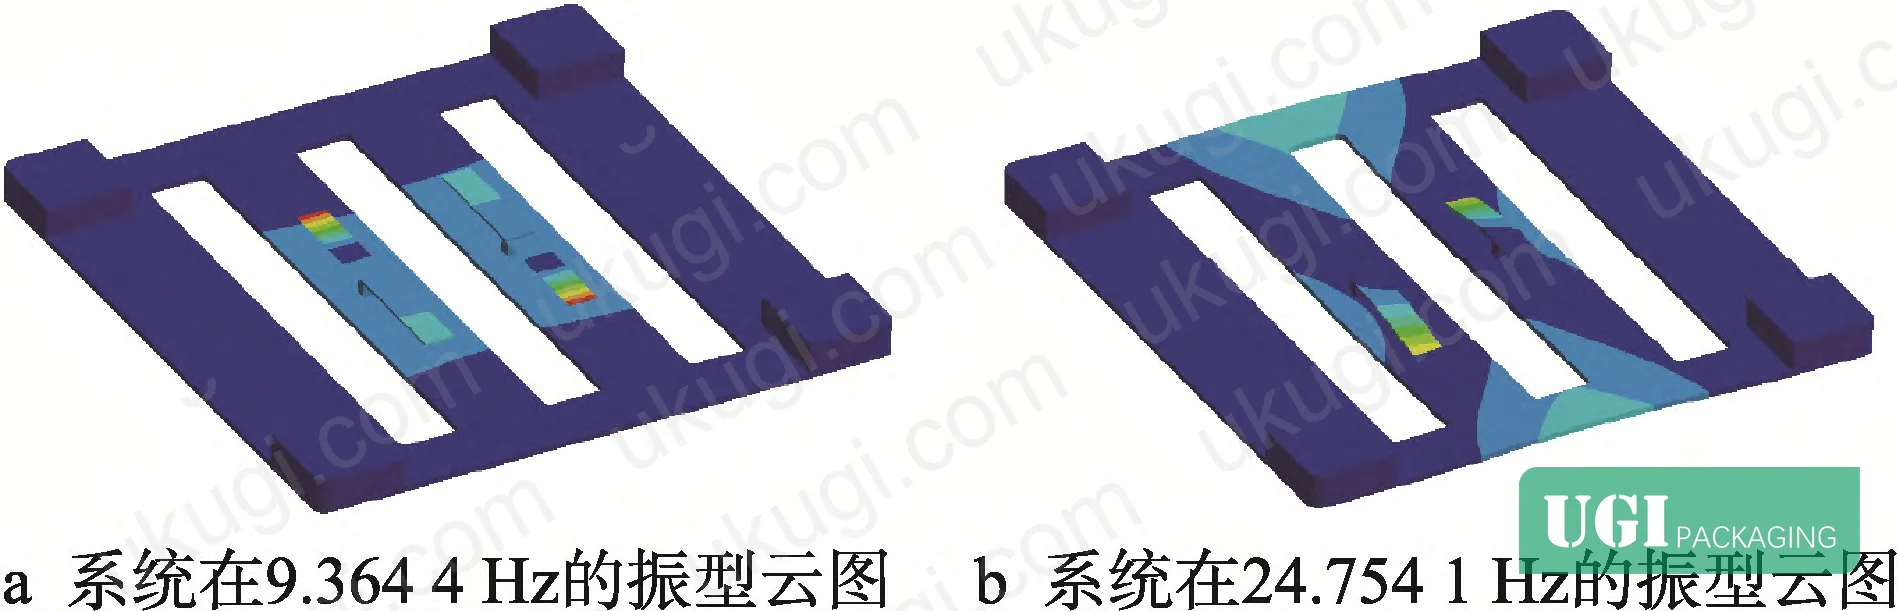
The composite oscillator configuration introduced two new local resonance modes at 9.364 4 Hz (targeting Mode 1 suppression) and 24.754 1 Hz (targeting Mode 2 suppression). This is the key architectural advantage: a single tray design that addresses both primary resonance peaks without requiring two separate oscillator types.
Most procurement teams don’t realize that transport vibration standards like ASTM D4169 — or more rigorously, ISO 12405-4 test specifications for battery pack vibration — are calibrated specifically to the 2–25 Hz road transport excitation band. The fact that this tray’s dominant resonance modes land at 8.77 Hz and 12.38 Hz is not coincidental; it’s exactly where road transport energy is concentrated. Tray suppliers who can’t discuss their product’s natural frequency profile are giving you an incomplete specification.
Practical Guidance for Buyers #
If you’re sourcing transit trays for precision electronics, medical devices, optical components, or any goods where in-transit vibration is a damage or functional risk, here’s what to actually do with this data.
First, get the natural frequency profile of any tray under evaluation. The first two modes should be documented — specifically whether they fall in the 2–25 Hz road transport band. A tray with Mode 1 at 8.77 Hz and no vibration absorption treatment is a liability for sensitive cargo on multi-day road shipments.
Second, understand that oscillator-based suppression is retrofit-compatible. The T-shaped attachment approach described here does not require redesigning the base tray. This has real procurement value: you can specify oscillator additions to an existing approved tray design without restarting qualification, provided the attachment interface is designed correctly. Mechanical interlocking or molded-in integration is preferable to adhesive bonding for anything above ambient temperature ranges.
Third, require vibration transmission test data, not just static compression certificates. A peak reduction of 5.2 dB from a single oscillator configuration — without changing tray footprint, material, or weight significantly — is the kind of specification improvement that makes a real difference in outbound damage claims. Require suppliers to provide frequency response curves from 0–50 Hz under vertical excitation at minimum.
For composite oscillator designs that suppress both Mode 1 (~9.4 Hz) and Mode 2 (~24.8 Hz) simultaneously, the total system improvement over unmodified trays exceeds what single-configuration oscillators achieve — and the manufacturing complexity added is modest (two cantilever beams of different thickness profiles). At ukugi.com, our team works with international packaging buyers to specify transit solutions with defined dynamic performance criteria — from structural design through production qualification. If your current tray supplier can’t provide vibration transmission data, that’s a gap worth addressing before your next product launch.
Need a custom formulation or sample? Request a quote from our team →
Technical Verification Questions #
- What are the first two natural frequencies of your tray design under four-corner fixed-support boundary conditions, and can you provide the FEA mode shape contour maps showing the primary vibration modes?
- If oscillators are incorporated, what are the measured local modal frequencies of each oscillator element — specifically, are they tuned to within ±1 Hz of the target tray resonance peaks (e.g., ~8.77 Hz and ~12.38 Hz for this tray geometry)?
- What is the peak vibration transmission value in dB at the first resonance frequency before and after oscillator addition, under a constant 1 mm/s² vertical acceleration input?
- For Oscillator 2 or equivalent stiff-arm designs, has modal coupling with adjacent structural beams been characterized — and what is the actual coupled-system natural frequency versus the theoretical cantilever-only natural frequency (reference: coupling shifts theoretical 91.7 Hz down to 25.246 3 Hz in this geometry)?
- What attachment method is used for oscillator-to-tray integration, and has joint compliance been validated to confirm the assembled system meets the specified vibration transmission reduction (e.g., ≥2.9 dB at Mode 1, ≥5.2 dB at Mode 2)?
Quality Verification Checklist #
- ☐ Tray natural frequencies documented: Mode 1 falls below 15 Hz and Mode 2 below 20 Hz, confirming resonance characterization covers the road transport excitation band (2–25 Hz)
- ☐ Oscillator 1 (thin arm, 1.7 mm) achieves a minimum 2.9 dB reduction in peak vibration transmission at Mode 1 resonance vs. unmodified baseline
- ☐ Oscillator 2 (thick arm, 5.2 mm) achieves a minimum 5.2 dB reduction in peak vibration transmission at Mode 2 resonance vs. unmodified baseline
- ☐ Composite oscillator configuration confirms two local modal frequencies present: one in 9.0–10.0 Hz range and one in 24.0–25.5 Hz range per FEA modal analysis
- ☐ Material parameters verified: elastic modulus ≥1100 MPa, density ≤950 kg/m³, Poisson’s ratio 0.38–0.45 (consistent with polyethylene tray specification)
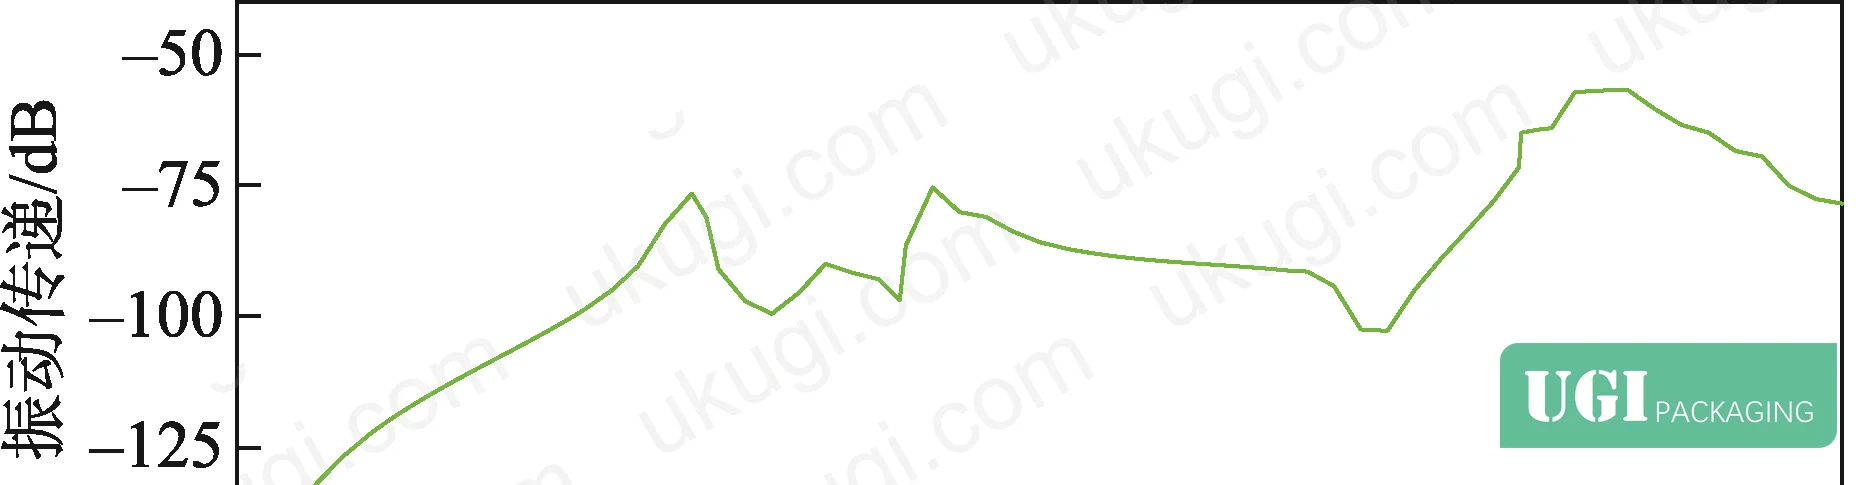
- ☐ Vibration transmission response is predominantly uniaxial (vertical/z-direction dominance confirmed; cross-axis coupling in x and y directions confirmed as negligible under vertical excitation)
- ☐ Oscillator attachment interface tested for joint compliance — assembled test result within 0.5 dB of FEA-predicted suppression level
Key Specifications Table #
| Parameter | Recommended Value | Verification Method |
|---|---|---|
| Tray external footprint | 1000 mm × 1000 mm maximum | Dimensional measurement per drawing |
| Central beam width / thickness | 200 mm wide, 10 mm thick; 100 mm hollow gap | Cross-section measurement |
| Tray material elastic modulus | 1100 MPa | Material datasheet or tensile test per ISO 527 |
| Tray material density | 950 kg/m³ | Gravimetric measurement |
| Mode 1 natural frequency | Target: <10 Hz (baseline ~8.77 Hz) | FEA modal analysis or impact hammer test |
| Mode 2 natural frequency | Target: <14 Hz (baseline ~12.38 Hz) | FEA modal analysis or impact hammer test |
| Oscillator 1 arm thickness | 1.7 mm (tuned to ~9.8 Hz local mode) | Physical measurement + FEA confirmation |
| Oscillator 2 arm thickness | 5.2 mm (coupled mode ~25.2 Hz) | Physical measurement + FEA confirmation |
| Peak transmission reduction (Oscillator 2) | ≥5.2 dB at Mode 2 resonance | Vibration transmission test, 1 mm/s² vertical input |
| Composite oscillator Mode 1 suppression frequency | 9.364 4 Hz ± 0.5 Hz | FEA modal extraction or accelerometer measurement |
| Composite oscillator Mode 2 suppression frequency | 24.754 1 Hz ± 0.5 Hz | FEA modal extraction or accelerometer measurement |
Looking for a manufacturer that meets these specifications? Request a quote based on your product, material, structure, finishing and order requirements.
References #
Data source: Vibration Suppression of Packaging Trays Using T-Shaped Cantilever Oscillators: Modal Analysis and Dynamic Characterization, H. Ni et al., Packaging Technology and Science, 2024
Frequently Asked Questions #
Q1: What is the difference between Oscillator 1 and Oscillator 2 in this tray design?
The only geometric difference is cantilever arm thickness: Oscillator 1 uses 1.7 mm arms and Oscillator 2 uses 5.2 mm arms (arm footprint is identical at 100 mm × 20 mm). That thickness difference changes the oscillator’s stiffness, its local natural frequency, and whether it behaves as an independent system or couples with adjacent tray beams. Oscillator 1 at 1.7 mm acts independently (actual frequency ≈ theoretical), while Oscillator 2 at 5.2 mm couples with the narrow lateral beam, shifting its operating frequency from a theoretical 91.7 Hz down to 25.246 3 Hz. Choose thickness based on which resonance peak you need to target.
Q2: Is a 5.2 dB vibration reduction actually meaningful for cargo protection?
Yes. A 5.2 dB reduction in peak transmission corresponds to approximately 44% lower peak amplitude at the tray surface. For fragile goods, that difference at the primary resonance frequency is the delta between acceptable and damaging acceleration exposure over a multi-hour transit.
Q3: Do I need oscillators on all four sides of the tray, or only at specific positions?
Oscillator placement is determined by modal participation — the oscillators must be positioned at the nodes of highest modal displacement for the target modes. The research confirms that oscillators placed at the correct structural positions on a 1000 mm × 1000 mm tray suppress both Mode 1 and Mode 2 without spatial cross-axis coupling. Placement at wrong positions would reduce effectiveness significantly.
Q4: Can this oscillator approach be applied to corrugated cardboard trays, or only plastic?
The research specifically models polyethylene (elastic modulus 1100 MPa, density 950 kg/m³). Corrugated board has substantially lower elastic modulus and more complex orthotropic behavior, which would shift all natural frequencies and change the coupling dynamics. The principle is transferable, but the specific oscillator dimensions would need to be redesigned for the corrugated substrate’s actual stiffness and damping properties. For high-value goods in corrugated transit solutions, consider our custom paper boxes with engineered insert systems as an alternative approach.
Q5: Does adding oscillators affect tray stacking strength or top-load performance?
The oscillators are attached to the tray underside and do not contribute to the compression load path. Stacking strength is determined by the tray’s vertical beam structure and support geometry, which remain unchanged. The oscillators add modest mass (concentrated at the cantilever mass element) but this is typically under 2–3% of total tray weight for the geometries described. For applications where gift packaging solutions or premium retail trays need both structural and dynamic performance, this retrofit approach keeps the primary load structure intact.
Published by ukugi.com Technical Team | Request a quote


