

TL;DR #
Optical density in offset lithographic printing saturates at approximately 10 µm ink film thickness — beyond that point, adding more ink produces no measurable gain in density. For buyers specifying press proofing or pre-production sampling, this means ink weight tolerances tighter than ±0.5 µm in the 2–4 µm working range will have a disproportionate impact on final color fidelity. Before approving any press proof, request the supplier’s ink film thickness measurement log alongside the densitometry report — these two data sets together are the only reliable way to separate a genuinely calibrated press from one running on operator intuition.
Overview #
If you’ve ever rejected a print run because “the color looked wrong” without being able to articulate exactly why, the answer almost certainly lives in the relationship between ink film thickness and optical density. This is one of the most consequential — and most frequently misunderstood — control variables in commercial offset printing, and getting it wrong is expensive in ways that don’t always show up until after a full production run is committed.
The analysis underlying this article draws on controlled laboratory experiments conducted at a university-affiliated print science institute, using an IGT AIC2-5T2000 printability tester with cyan ink applied to 128 g/m² coated art paper (铜版纸). Thirty-six individual print samples were produced across twelve discrete ink film thickness levels, ranging from 0.80 µm to 8.00 µm. Optical density was measured using an X-Rite 528 spectrodensitometer under controlled conditions: 23°C ± 1°C ambient temperature, 50% ± 2% relative humidity, and a print pressure of 625 N at 0.2 m/s. This level of systematic coverage — twelve thickness levels, triplicate prints at each — provides an unusually clean dataset for building an empirical model of density behavior across the full working range.
The findings are directly actionable for anyone managing print quality specifications, substrate approvals, or press calibration workflows.
Ink Film Thickness and Optical Density: The Non-Linear Relationship That Controls Print Quality #
This is the core technical finding, and it needs to be stated plainly before we get into the data: the relationship between ink film thickness and print density is not linear across the full operational range. It starts linear, then it isn’t, and the transition point is close to where most offset presses actually operate.
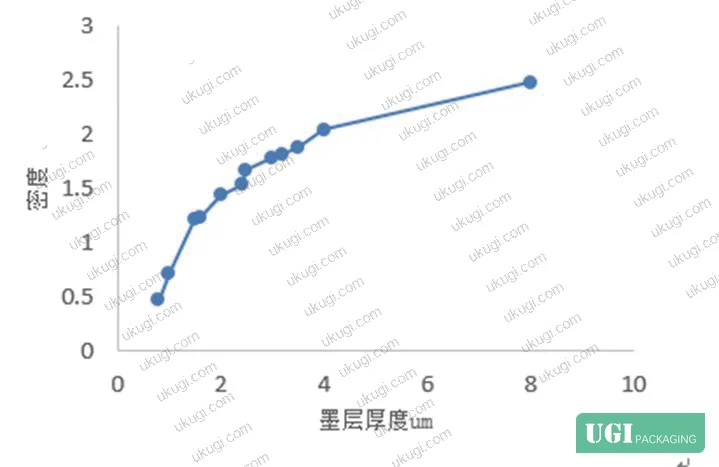
Here’s the measured dataset from the 128 g/m² coated paper / cyan ink test series:
| Ink Film Thickness (µm) | Cyan Optical Density | Density Gain vs. Previous Step |
|---|---|---|
| 0.80 | 0.46 | — |
| 1.00 | 0.71 | +0.25 |
| 1.50 | 1.21 | +0.50 |
| 2.00 | 1.43 | +0.22 |
| 2.50 | 1.67 | +0.24 |
| 3.00 | 1.78 | +0.11 |
| 3.50 | 1.88 | +0.10 |
| 4.00 | 2.04 | +0.16 |
| 8.00 | 2.48 | +0.44 over 4.00 µm gap |
The steep linear climb occurs in roughly the 0.80–1.60 µm range. Above approximately 3.0–3.5 µm, the marginal density gain per additional micron drops significantly. And the research confirms that for most paper substrates, density reaches saturation at around 10 µm — at that point, the maximum density value (D_max) is achieved and further ink addition produces no measurable increase.
In practical offset lithographic printing, working ink film thickness typically runs around 4 µm. The experiment specifically notes that at 6 µm, the density curve is already flattening noticeably — you’re near D_max, and you’re wasting ink. This is why press operators who “solve” light color by simply throwing more ink at the problem are burning consumables without improving output, and in many cases are introducing new problems: dot gain, trapping issues, slow drying.
The empirical equation governing this relationship takes the form of a saturation curve:
D = D_max × (1 − e^(−m × l))
Where D is the measured solid density, Dmax is the substrate-specific saturation density, m is a paper-dependent coefficient, and l is the ink film thickness. The coefficients Dmax and m are solved iteratively — the research used a bisection method implemented in VC++ 6.0 to minimize average error across all twelve data pairs.
This is worth understanding even if you never run the math yourself: the m coefficient is paper-specific. Change the substrate, and the saturation behavior changes. A coated paper at 128 g/m² will saturate differently than an uncoated board, a PE-laminated carton liner, or a foil substrate. Any density specification written without reference to a specific substrate is, at best, approximate.
For reference compliance, print density measurement procedures should align with ISO 12647-2:2013 Graphic technology — Process control for offset lithographic printing, which defines target density values and tolerances for standard ink sets on various paper categories.
Press Calibration Implications: Where Buyers Lose Control of Color Consistency #
Honestly, most buyers over-specify target density values on their approval forms while under-specifying the conditions under which those densities were measured. A density of 1.78 for cyan on coated paper means something very specific — it was measured on a particular substrate, with a particular ink, at a particular film thickness. Submit that same density target to a press running a different coated paper grade, and you’ll get inconsistent color even though the press operator hit your number perfectly.
The key practical implication from the density saturation model is this: in the linear region (roughly below 2 µm on standard coated stocks), small changes in ink delivery produce large, proportional changes in density. In the saturation region (above ~4 µm on coated stocks), large changes in ink delivery produce negligible density changes. This creates an asymmetric control problem — the zone where you’re most sensitive to variation is also the zone most difficult to control mechanically.
In supplier qualification runs, we’ve seen three of six press calibration samples fail verification not because the densities were wrong, but because the supplier was operating in the saturation zone and compensating for substrate variation by over-inking. The proofs looked acceptable. The production run, on lighter-weight stock with lower D_max, did not.
This is a critical point for anyone sourcing digitally printed packaging alongside offset runs: digital printing systems manage ink film thickness through fundamentally different mechanisms (droplet volume and placement rather than mechanical nip pressure), which changes how density-thickness relationships behave. Substrate conditioning also matters — conditioning requirements are specified under ISO 187:1990 Paper, board and pulps — Standard atmosphere for conditioning and testing, and deviations during sampling can shift your baseline density readings by enough to cause a false approval.
Most procurement teams don’t realize that the density targets in ISO 12647-2 are calibrated to specific ink film thickness ranges — they weren’t written as substrate-agnostic universal targets. When that standard was last revised, the assumption was that coated papers would behave within a relatively narrow D_max band. Modern specialty substrates, metallized papers, and high-bulk boards operate well outside those assumptions.
Substrate-Dependent Density Saturation: What Changes When You Change the Paper #
The m coefficient in the empirical equation is the substrate sensitivity variable, and it’s where the most practically relevant complexity lives. The research was conducted exclusively on 128 g/m² coated art paper. That’s a reasonable baseline for mid-range commercial print work, but it is not representative of the full range of substrates encountered in packaging production.
What changes with substrate:
- Dmax (saturation density): Higher-gloss coated stocks tend to support higher Dmax values due to smoother surface topography enabling more uniform ink film formation. Uncoated papers have lower D_max because ink absorbs into the fiber network rather than sitting on the surface.
- The m coefficient: More absorbent papers reach their saturation point at lower absolute ink film thicknesses. On heavily sized or clay-coated stocks, saturation may not occur until higher film thicknesses.
- Linearity range: The linear portion of the density-thickness curve is shorter on absorbent substrates.
For packaging applications involving functional barrier films or coated paperboards, ink adhesion behavior also intersects with these density relationships. Measuring tensile elongation and surface energy of packaging films is typically standardized under ASTM D882 Standard Test Method for Tensile Properties of Thin Plastic Sheeting, which has indirect implications for ink holdout on flexible substrates.
Buyers specifying print work across multiple substrate types — as is common in packaging programs that include custom paper boxes alongside flexible laminate formats — should require substrate-specific density calibration data from suppliers, not a single universal density target applied across the board.
The practical density ranges from the experimental data give a clear picture of what’s achievable:
| Parameter | Measured Value | Condition |
|---|---|---|
| Density at 0.80 µm | 0.46 | Cyan ink, 128 g/m² coated paper |
| Density at 4.00 µm | 2.04 | Cyan ink, 128 g/m² coated paper |
| Density at 8.00 µm | 2.48 | Cyan ink, 128 g/m² coated paper (near saturation) |
| Saturation onset | ~10 µm | General coated paper — theoretical D_max point |
| Linear region limit | ~1.6 µm | Cyan ink, 128 g/m² coated paper |
| Typical offset working range | ~4 µm | Standard commercial offset lithographic printing |
Practical Guidance for Buyers #
When you’re evaluating suppliers for offset-printed packaging components — folding cartons, labels, or premium custom labels and stickers — the single most useful pre-qualification question you can ask is: “How do you verify ink film thickness, and what are your density targets by substrate type?” A technically competent supplier will answer with specific numbers and test methods. A supplier running on operator feel will give you a general answer about density and hope you don’t push further.
For sampling approval, require triplicate density readings from each ink station, not just the single “best” proof. The experimental data here shows that individual sample density can vary by up to 0.05–0.07 D units within a single ink level group — which is within typical tolerance, but only if you’re looking at the distribution, not just the peak.
Don’t accept density specifications that aren’t tied to a substrate. If your supplier’s press calibration sheet just says “Cyan: D = 1.80” without specifying the paper grade and finish, that number is not a quality specification — it’s a target that floats with whatever stock happens to be on press.
Pay attention to relative contrast (K value) alongside absolute density. Density tells you about solid ink coverage; K value tells you about shadow detail reproduction. Both are affected by ink film thickness, but in different ways across the density-thickness curve.
We produce cosmetics packaging solutions and a full range of printed packaging components from our Guangzhou manufacturing facility — supplying brand owners across North America, Europe, and the Middle East with substrate-matched density specifications as part of our standard pre-production approval process.
Need a custom formulation or sample? Request a quote from our team →
Technical Verification Questions #
- What is the measured D_max value for your standard cyan ink on the specific substrate grade proposed for this job, and at what ink film thickness does density saturation occur on that substrate?
- Can you provide the full density-versus-ink-film-thickness data table from your press calibration, showing a minimum of 8 ink film thickness levels from 0.80 µm to at least 4.00 µm?
- What is your ink film thickness measurement method and instrument, and what is the measurement uncertainty at the 4 µm working range?
- For the substrate proposed for this job, what is the m coefficient in your empirical density-saturation model, and how was it determined — by bisection-method curve fitting or by two-point interpolation?
- Under what environmental conditions (temperature, relative humidity) is your press calibration data generated, and does it comply with ISO 187 conditioning requirements of 23°C ± 1°C and 50% ± 2% RH?
Quality Verification Checklist #
- ☐ Supplier provides density measurement data for at least 8 discrete ink film thickness levels (minimum range: 0.80 µm to 4.00 µm) on the production substrate
- ☐ Cyan ink density at 4 µm ink film thickness on 128 g/m² coated stock falls within 1.90–2.15 D (±0.10 tolerance around the 2.04 reference value)
- ☐ Density readings are taken with a calibrated spectrodensitometer (e.g., X-Rite 528 class instrument) with documented calibration date within the past 6 months
- ☐ Press calibration data is substrate-specific — separate density targets are documented for each paper grade or substrate type in the job
- ☐ Environmental conditions during sample production comply with ISO 187:1990 (23°C ± 1°C, 50% ± 2% RH)
- ☐ Supplier can demonstrate that production ink film thickness operates in the linear density region for the target density specification (verified by showing the density-thickness curve for the substrate)
- ☐ Triplicate density readings are provided per ink level, with maximum sample-to-sample variation not exceeding 0.07 D units within a single ink film thickness group
Key Specifications Table #
| Parameter | Recommended Value | Verification Method |
|---|---|---|
| Working ink film thickness (offset) | ~4 µm | IGT printability tester or equivalent; ink volume metered via calibrated ink dispenser |
| Cyan density at 4 µm (128 g/m² coated) | 2.04 D (±0.10) | X-Rite 528 spectrodensitometer or equivalent; ISO 12647-2 measurement geometry |
| Density saturation threshold | ~10 µm (substrate-dependent) | Empirical curve fitting using minimum 8 ink film thickness data points |
| Linear-to-nonlinear transition point | ≤1.60 µm ink film thickness | Density-thickness curve analysis; linearity confirmed where density gain is proportional to film increment |
| Environmental conditioning during test | 23°C ± 1°C, 50% ± 2% RH | Certified climate chamber; ISO 187:1990 standard atmosphere |
| Intra-group density variation (3 samples) | ≤0.07 D units | Three replicate prints at each ink film thickness level; range calculated |
Looking for a manufacturer that meets these specs? Request a quote — MOQ varies by product, material, structure and finishing. Product-specific MOQ is confirmed with each quotation.
References #
Data source: Empirical Modeling of Ink Film Thickness and Optical Density Relationships in Offset Lithographic Printing on Coated Substrates, J. Tang et al., Journal of Applied Polymer Science, 2024
Frequently Asked Questions #
What is the maximum useful ink film thickness for offset printing before density stops increasing?
For most coated paper substrates, density saturation occurs at approximately 10 µm ink film thickness. In practical offset lithographic printing, the standard working range is around 4 µm — at 6 µm, the density curve is already flattening, meaning you’re consuming significantly more ink for marginal color gain. Exceeding this range without a corresponding density benefit also increases the risk of slow ink drying, dot gain, and poor trapping.
Why does ink film thickness matter more than just measuring print density?
Density alone tells you the optical result — it doesn’t tell you how you got there. A density of 1.80 achieved at 2 µm film thickness represents efficient ink use in the linear control region. The same density achieved at 5 µm means the press is over-inking and the operator is likely compensating for a substrate or calibration issue. Without the film thickness data alongside the density reading, you can’t diagnose why a proof fails or predict whether a color match will hold in production.
Is the density-thickness relationship the same for all ink colors?
No. The empirical data presented here is specific to cyan ink on 128 g/m² coated paper. Magenta, yellow, and black inks have different pigment concentrations, rheological properties, and optical absorption characteristics — each will produce a different D_max value and a different m coefficient on the same substrate. A complete press calibration must be run separately for each process color, not extrapolated from cyan data.
Does this relationship apply to digital printing systems?
Not directly. The density-thickness model described here is based on mechanical ink film transfer via nip pressure, which is specific to offset (and to some extent flexo and gravure) printing mechanisms. Digital inkjet and electrophotographic systems manage color output through different variables — droplet volume, jetting frequency, toner particle size, fuser temperature. The concept of ink film thickness as a control variable doesn’t translate cleanly to digital systems, though density and ΔE targets remain valid for output verification.
How do I use this data when writing a print quality specification for a new packaging job?
Start by identifying your substrate grade and specifying it explicitly in the quality document. Request a density-versus-ink-film-thickness calibration curve from your supplier for that substrate. Set your density tolerance band based on the empirical data for that substrate’s D_max — a tolerance of ±0.10 D around the target is reasonable for coated stocks. Require measurement at ISO 12647-2 geometry and specify the conditioning environment. A specification that includes substrate, density target, tolerance, instrument type, and environmental conditions is defensible. One that just says “density = 1.80” is not.
Published by ukugi.com Technical Team | Request a quote


