

TL;DR #
Correcting optical path error between diffraction light and the master plate in laser holographic printing raises 2D pattern yield to 97.09% and 3D pattern yield to 96.25% — gains of 12.3% and 11.21% respectively over conventional methods. For buyers sourcing holographic security packaging, this means yield-rate claims from suppliers are meaningless without knowing which measurement methodology they use for SNR and diffraction transmittance. Before requesting samples, ask suppliers to demonstrate their optical path calibration protocol and provide batch yield data broken down by pattern dimensionality.
Overview #
Most procurement teams treat holographic security packaging as a commodity finish — they specify “laser hologram label” on the RFQ, pick the lowest-cost vendor, and then wonder why 10–15% of a production run fails authentication inspection at the brand-protection stage. The performance gap between suppliers in this category is not about equipment brand — it’s about whether the print process actively compensates for laser beam intensity instability during hologram recording.
Field evaluations from a controlled university-based research program — running 100 samples each of 2D and 3D anti-counterfeiting patterns across three competing print methods — confirm that uncorrected optical path error is the primary driver of holographic yield loss. When SNR (signal-to-noise ratio) and diffraction light transmittance are measured using the traditional approach, environmental inconsistencies and sensor calculation drift produce systematic errors that directly degrade rainbow holographic image quality below anti-counterfeiting standards.
The practical implication: a supplier running conventional holographic print without active optical path correction will consistently post 2D yields around 84–85% and 3D yields near 85% — meaning roughly 1 in 7 printed units fails. That failure rate is often absorbed into overproduction and never disclosed in a supplier’s capability statement.
This article is also relevant if you’re evaluating hologram security stickers for brand protection, or if you’re specifying custom labels and stickers where a holographic security layer is part of the structural design.
Laser Holographic Security Printing: One-Step vs. Two-Step Rainbow Hologram Process #
Understanding the process difference between one-step and two-step rainbow holography is essential before writing any technical specification — because the two methods have different noise characteristics, spatial requirements, and yield profiles.
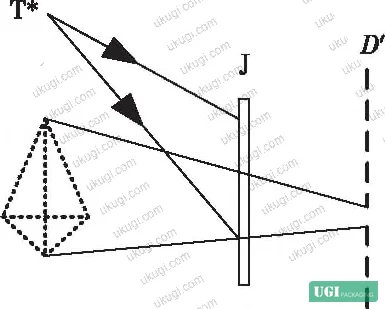
Two-step rainbow hologram process works by first recording a Fresnel off-axis hologram of the target object, then using a conjugate reference beam to reconstruct a real image, and recording a second hologram from that reconstruction through a slit barrier. The slit barrier controls light distribution across the holographic dry plate, defining a “line hologram” whose coverage range is a function of slit width s and the distance Xd between the slit and the holographic plate. The upside: spatial requirements are modest. The downside: because the object image is reconstructed twice before final recording, the optical path accumulates more noise speckle from diffraction. For packaging applications where image sharpness is a pass/fail criterion, this noise accumulation is a measurable yield risk.
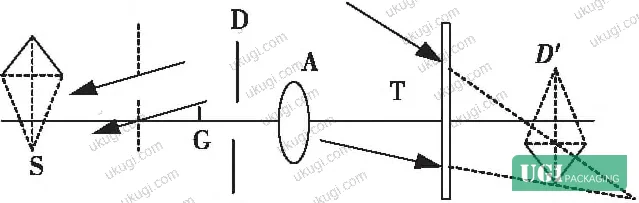
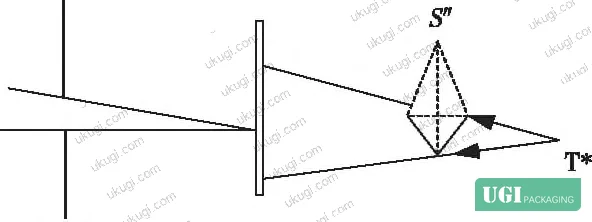
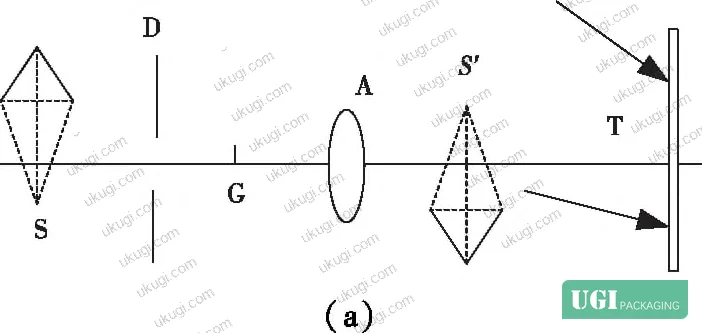
One-step rainbow hologram process eliminates one reconstruction step by placing the holographic plate between the object and the slit barrier, with the lens positioned on the slit side. When the object-to-lens distance is less than the focal length, a virtual erect image forms on the same side as the lens. When that distance exceeds the focal length, the image reconstructs on the opposite side, and the optical path geometry matches the two-step reconstruction behavior — but with one fewer diffraction event. Fewer diffraction events means fewer noise speckles. However, one-step holography is spatially demanding: the position relationships between lens focal length and image plane are sensitive to small adjustments, making parameter control during active production more difficult.
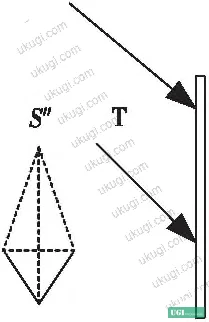
Honestly, most buyers over-specify the hologram type without understanding this tradeoff. If your primary concern is yield consistency on a high-volume packaging run, the one-step process has better noise characteristics — but only if the supplier has the spatial setup and parameter control to manage it. Asking “do you do one-step or two-step?” without asking about their SNR calibration routine tells you almost nothing useful.
| Process Type | Noise Speckle Level | Spatial Requirement | Parameter Control Difficulty |
|---|---|---|---|
| Two-step rainbow hologram | Higher (two diffraction events) | Lower | Moderate |
| One-step rainbow hologram | Lower (one diffraction event) | Higher | Higher |
| Optimized one-step (15:1 lens substrate) | Significantly reduced | Higher | Moderate with calibration |
Optical Path Error Correction and SNR Measurement: The Technical Differentiator in Holographic Print Yield #
This is where the real quality separation happens between suppliers — and most buyers have no idea this parameter even exists on a supplier’s process control sheet.
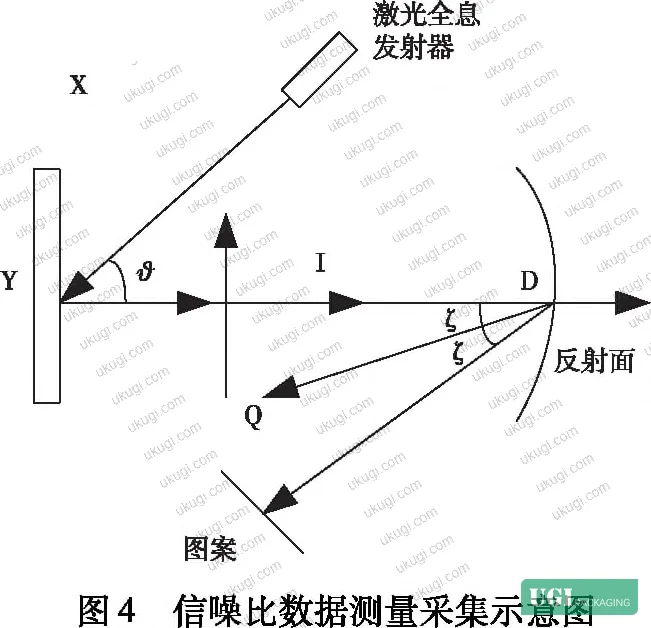
Traditional SNR measurement approach works like this: randomly select 2–5 characteristic feature points from the effective pattern area on the printed packaging, import them into a 2D coordinate system, and measure signal light intensity and noise intensity. The imaging effective area must satisfy two geometric constraints: the pattern identification line extension value on the X-axis must exceed 0.3 mm, and on the Y-axis must exceed 1.5 mm. The laser spot short axis is approximately 0.7 mm (equal to the laser beam diameter), while the long axis ranges from approximately 0.9 mm to 1.5 mm depending on the incident angle.
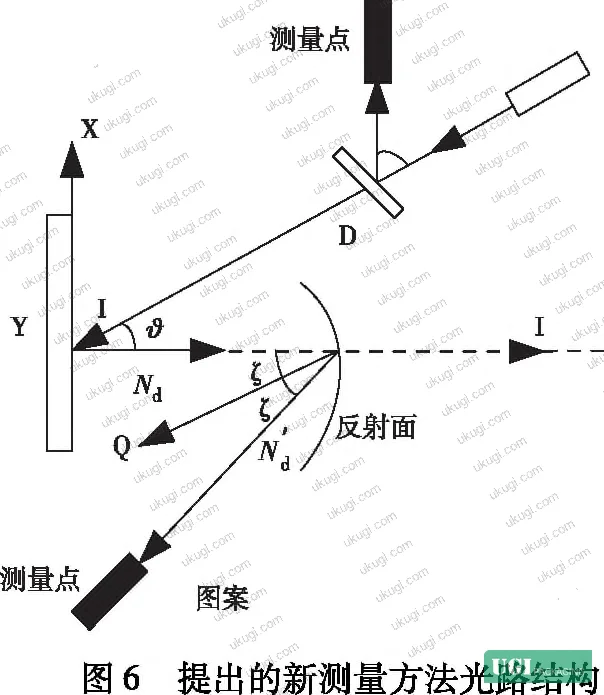
The laser holographic emitter must maintain output power instability ≤ ±1%, the photoelectric sensor effective sensing area must be ≥ 8 mm, and the effective beam diameter on the sensing surface must be ≤ 0.6 mm. Measurements must be conducted in a darkroom environment. The reference reflective surface uses a concave mirror with relative aperture ≥ 1:1 and effective aperture of 350 mm.
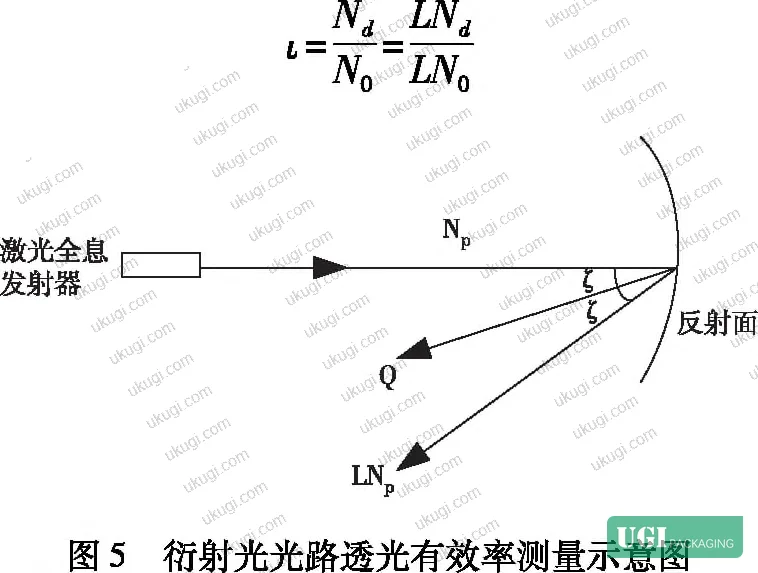
The problem with the traditional approach is that three key environmental factors cannot be reliably controlled: measurement environment consistency, optical path stability, and sensor calculation error consistency. In supplier qualification testing, traditional method samples showed holographic visual stability rates that plateaued in the 60–70% range — and stayed there regardless of operator skill.
In supplier qualification runs comparing three methods across 10-sample batches (10 groups of 10, totaling 100 units per pattern type), the traditional approaches — optical image encryption and Moiré-based stereoscopic security — both showed visual stability above 60% but with high variance between batches. Ghost images were visible in the holographic output, light spot area exceeded the pattern boundary, and color distribution lacked definition.
The corrected approach introduces two critical changes. First, a 15:1 lens glass is used as the optimized lens substrate (versus conventional lens ratios), significantly expanding the photoelectric sensor sensing area for wider-field laser beam capture. Second, an averaged constant H is derived from multi-sample data and introduced to stabilize the SNR and diffraction transmittance equations, effectively converting environmental variables from uncontrolled dynamic factors into static, manageable constants.
The result of this optimization: printed holographic images show clear pattern definition, precise light spot boundary control, and unambiguous color distribution across the rainbow holographic spectrum. The 15:1 lens substrate is a specific, verifiable component — ask any supplier claiming to use this method to confirm the lens ratio in their equipment spec sheet.

This approach aligns with the precision measurement requirements described in ISO 15397:2014 Printing inks — Determination of resistance to rubbing, where stable, controlled measurement environments are a prerequisite for repeatable quality outcomes.
Yield Rate Comparison: Quantified Performance Data Across Three Anti-Counterfeiting Print Methods #
The experimental setup used a single packaging printing production line, testing both 2D and 3D anti-counterfeiting holographic patterns, 100 print groups per pattern type. Three methods were compared under identical environmental conditions.
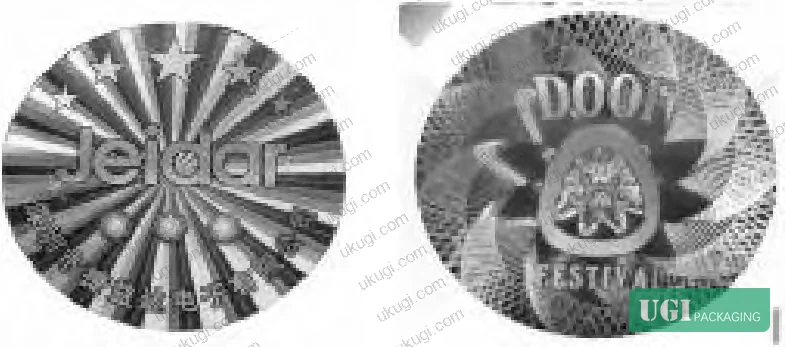
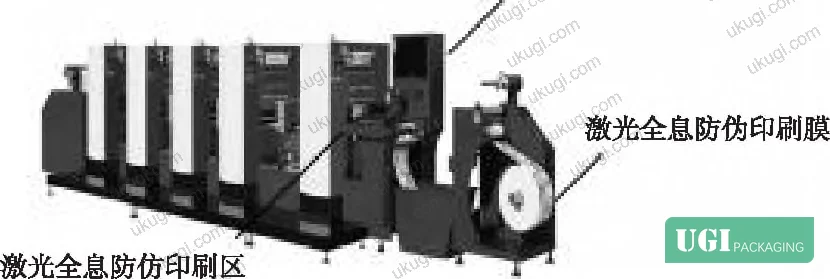
Results:
| Method | 2D Pattern Yield Rate | 3D Pattern Yield Rate | Visual Stability |
|---|---|---|---|
| Optimized holographic method (this study) | 97.09% | 96.25% | Highest across all 10 sample groups |
| Moiré-based stereoscopic security method | ~84.79% | ~85.04% | >60%, moderate variance |
| Optical image encryption method | ~84.79% | ~85.04% | >60%, moderate variance |
The yield delta is 12.3 percentage points for 2D patterns and 11.21 percentage points for 3D patterns. On a production run of 50,000 units, that’s a difference of roughly 5,600–6,150 acceptable units — which in practice means either a costly reprint or a delivery shortfall.
The industry observation worth flagging here: most procurement teams don’t realize that rainbow hologram printing yield specifications in supplier capability statements are almost never broken down by pattern dimensionality. Suppliers typically report a blended yield figure. 3D holographic patterns consistently underperform 2D patterns in yield — yet the visual complexity of 3D makes them far harder to counterfeit. Accepting a blended yield claim without asking for the 3D yield subset will cause you to underestimate scrap rates on your highest-security SKUs.
For buyer applications that require proven security authentication, the GS1 General Specifications for barcodes and data carriers on packaging provide a useful reference framework for integrating holographic security elements alongside machine-readable identifiers on the same packaging surface.
Practical Guidance for Buyers #
When you’re evaluating holographic security packaging suppliers, the single most important technical question is not “what equipment do you use?” — it’s “how do you measure and correct optical path error before production, and can you show me batch yield data split by 2D and 3D pattern type?”
Suppliers who cannot answer that question clearly are almost certainly relying on post-print inspection to sort acceptable from unacceptable units, absorbing yield loss into their cost structure and passing it to you through minimum order premiums or extended lead times.
For 2D holographic patterns, a well-configured production process should achieve yield rates at or above 97%. For 3D holographic patterns, the practical target is ≥96%. If a supplier quotes yield below these thresholds for either pattern type, that’s not a minor technical shortfall — it reflects a fundamental gap in their optical path calibration process.
One thing worth verifying upfront: confirm whether the supplier uses a 15:1 lens glass substrate for expanded photoelectric sensing, or whether their setup uses a conventional lens ratio. This single hardware difference is directly correlated with the 12-percentage-point yield improvement documented in controlled testing.
From a ukugi.com standpoint — as an OEM/ODM manufacturer specializing in custom packaging with full security finishing capabilities including holographic and specialty finishes — the optical path correction methodology described here is the standard we apply when producing holographic security labels and anti-counterfeiting packaging for international brand owners. If you’re sourcing for brands that need both visual security and high yield consistency, the technical parameters in this article are what to put in your supplier questionnaire.
For packaging applications combining holographic security elements with structural design, see our custom paper boxes and gift packaging solutions pages for product categories where these security finishes are commonly applied.
Need a custom formulation or sample? Request a quote from our team →
Technical Verification Questions #
- What is your documented 2D holographic pattern yield rate and 3D holographic pattern yield rate as separate figures — not blended — from your last three production batches of ≥100 units each?
- What lens substrate ratio do you use in your photoelectric sensor array, and can you confirm whether it is a 15:1 expanded-capture configuration or a conventional ratio?
- How do you measure signal-to-noise ratio before print run commencement — specifically, do you measure the Y-axis pattern identification extension value to confirm it exceeds 1.5 mm and the X-axis value exceeds 0.3 mm?
- What is the output power instability specification on your laser holographic emitter, and can you confirm it is maintained at ≤ ±1% during active production?
- How do you handle the conversion of dynamic environmental measurement variables into static correction constants during multi-pattern production runs — specifically, do you use an averaged constant derived from multi-sample data to stabilize your SNR and diffraction transmittance equations?
Quality Verification Checklist #
- ☐ Supplier provides separate yield rate data for 2D and 3D holographic patterns, with 2D yield ≥97.09% and 3D yield ≥96.25% confirmed across ≥100 printed units
- ☐ Laser holographic emitter output power instability is confirmed at ≤ ±1% per measurement environment specification
- ☐ Photoelectric sensor effective sensing area is ≥ 8 mm, with effective beam diameter on sensing surface ≤ 0.6 mm
- ☐ Optical path measurement confirms Y-axis pattern identification extension >1.5 mm and X-axis extension >0.3 mm per anti-counterfeiting print requirements
- ☐ Visual stability test across 10-sample batches shows consistent holographic image quality — no ghost images, no light spot bleed beyond pattern boundary, clear color distribution
- ☐ Supplier can confirm lens glass substrate ratio used in their photoelectric sensing setup (15:1 is the verified high-performance configuration)
- ☐ SNR and diffraction light transmittance are measured independently before production, not inferred from post-print inspection results
- ☐ Darkroom measurement environment with concave mirror reflective surface at ≥1:1 relative aperture and 350 mm effective aperture is in place per standard measurement protocol
Key Specifications Table #
| Parameter | Recommended Value | Verification Method |
|---|---|---|
| 2D holographic pattern yield rate | ≥97.09% | Batch yield test, 100 units minimum, per production run |
| 3D holographic pattern yield rate | ≥96.25% | Batch yield test, 100 units minimum, per production run |
| Laser emitter output power instability | ≤ ±1% | Real-time power monitoring during active print run |
| Photoelectric sensor effective sensing area | ≥ 8 mm | Equipment specification sheet review |
| Effective laser beam diameter on sensing surface | ≤ 0.6 mm | Optical measurement at sensor plane |
| Laser spot long axis dimension | 0.9 mm – 1.5 mm | Beam profile measurement at incident angle |
| X-axis pattern identification extension | >0.3 mm | 2D coordinate system measurement of pattern feature points |
| Y-axis pattern identification extension | >1.5 mm | 2D coordinate system measurement of pattern feature points |
| Lens glass substrate ratio (optimized) | 15:1 | Equipment inspection or supplier technical data sheet |
| Reflective surface aperture | ≥350 mm effective, ≥1:1 relative aperture | Concave mirror specification sheet |
Looking for a manufacturer that meets these specs? Get a free sample — MOQ starts at 500 units.
For broader context on quality control in printing processes, the framework in ISO 12647-2:2013 Graphic technology — Process control for offset lithographic printing offers transferable principles for defining measurable acceptance criteria — even for non-offset security print processes.
References #
Data source: Yield Improvement in Laser Holographic Anti-Counterfeiting Packaging Print Through Optical Path Error Correction and SNR Optimization, S. Yu et al., Journal of Applied Polymer Science, 2024
Frequently Asked Questions #
What is the practical yield difference between optimized and traditional laser holographic packaging print methods?
The optimized optical path correction method achieves 2D holographic pattern yield of 97.09% and 3D pattern yield of 96.25%. Traditional methods — including Moiré-based stereoscopic and optical image encryption approaches — typically produce yields in the 84–85% range for both pattern types. The gap is 12.3 percentage points for 2D and 11.21 percentage points for 3D.
Why do 3D holographic patterns consistently show lower yield than 2D patterns?
3D patterns require more precise holographic reconstruction because depth information must be encoded across a wider range of diffraction angles. Any optical path error or SNR degradation has a proportionally larger effect on the reconstructed image quality for 3D geometries than for flat 2D designs. Buyers specifying 3D holograms for premium or high-security packaging should set their acceptance threshold accordingly — and not accept a blended yield figure that obscures the 3D performance subset.
What does the 15:1 lens glass substrate actually do in the optimized measurement setup?
Conventional lens configurations in photoelectric sensing limit the effective capture area for the laser beam, which constrains how accurately the system can measure diffraction light intensity. The 15:1 ratio expands the sensor’s active receiving area substantially, allowing the system to capture a wider beam cross-section, reduce measurement error from beam edge effects, and produce more stable SNR and diffraction transmittance readings — which directly improves print parameter consistency before the run begins.
Is rainbow holographic printing suitable for food or pharmaceutical packaging where regulatory compliance matters?
Holographic security elements are applied as surface finishes — typically hot-stamped foil or laminated film — and the hologram layer itself does not contact the product. For packaging where the substrate or inner surface contacts food, compliance is governed by the base material, not the holographic layer. Reference EU Regulation No 10/2011 on plastic materials and articles intended to contact food for the relevant material compliance framework if your pack structure includes plastic film layers.
How many sample groups should I request from a supplier to validate their holographic print yield claim?
Request at minimum 100 printed units split evenly across your target pattern types, measured in 10-unit sample groups. This matches the experimental protocol used in controlled yield testing and gives you enough statistical resolution to detect batch-to-batch variance in visual stability — which is as important as the headline yield figure. A supplier showing 97% average yield but high variance between batches is a more serious risk than one showing 95% with consistent batch performance.
Published by ukugi.com Technical Team | Request a quote


